Fig. 5.
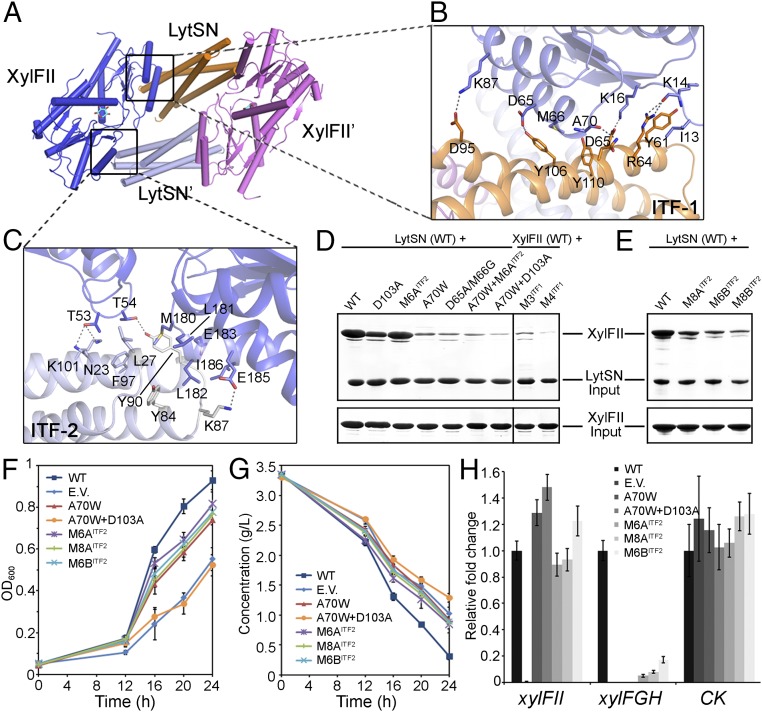
d-xylose binding induced the formation of an active tetramer. (A) Interaction interfaces within the active tetramer. The tetramer is a homodimer of XylFII-LystN/XylFII′-LystN′ heterodimers. The interfaces 1 and 2 (ITF-1 and ITF-2) are indicated. (B) Zoom-in view showing the interactions at ITF-1. Residues from XylFII (slate blue) and LytsN (orange) at ITF-1 are shown with their side chains. The dashed lines indicate hydrogen bonding interactions. (C) Zoom-in view showing the interactions at ITF-2. Residues from XylFII (slate blue) and LytsN′ (gray) at ITF-2 are shown with their side chains. The dashed lines indicate hydrogen-bonding interactions. (D and E) SDS/PAGE showing the effects of the ITF-1 and ITF-2 mutations on complex formation determined by the in vitro pull-down experiments. (F) Growth of C. beijerinckii affected by the ITF-1 and ITF-2 mutations. The growth rates were monitored by transforming XylFII (WT), empty pXY1 vector (EV), or XylFII genes containing mutations at ITF-1 and ITF-2 [i.e., XylFIIA70W (A70W), XylFIIA70W+D103A (A70W+D103A), XylFIIM6A (M6AITF2), XylFIIM6B (M6BITF2), or XylFIIM8A (M8AITF2)] to the xylFII mutant strain and growing them in YP2 medium with d-xylose as the sole carbon source. The bars indicate the SDs of three independent experiments. (G) d-xylose consumption of C. beijerinckii affected by the ITF-1 and ITF-2 mutations. The residual d-xylose in the medium were monitored by transforming XylFII (WT), empty pXY1 vector (EV), or XylFII genes containing mutations at ITF-1 and ITF-2 [i.e., XylFIIA70W (A70W), XylFIIA70W+D103A (A70W+D103A), xylFIIM6A (M6AITF2), XylFIIM6B (M6BITF2), or XylFIIM8A (M8AITF2)] to the xylFII mutant strain and growing them in YP2 medium with d-xylose as the sole carbon source. The bars indicate the SDs of three independent experiments. (H) Expression levels of genes affected by the ITF-1 and ITF-2 mutations. The expression levels of XylFII, the downstream target d-xylose ABC transporter xylFGH genes, and a gene encoding pullulanase (CK) were measured using qRT-PCR. Gene expression levels are represented as fold differences normalized to WT. The error bars indicate the SDs of three independent experiments.

