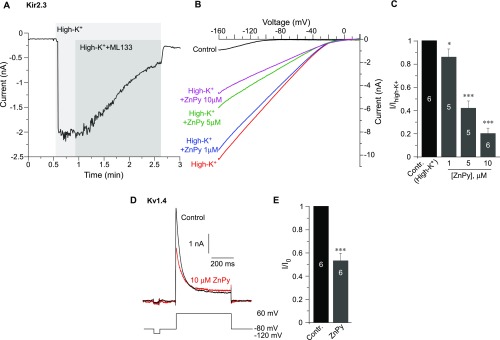
Fig. S9.
Effects of ZnPy on Kir2.3 and Kv1.4. (A–C) Effect of ZnPy on Kir2.3. (A) Whole-cell patch-clamp recording from the HEK293 cells transfected with Kir2.3 (kind gift from Diomedis Logothetis, Virginia Commonwealth University School of Medicine, Richmond, VA) and GFP showing the time courses of the effect of 30 μM of the Kir channel inhibitor ML133 on the amplitude of the Kir2.3 current. Currents were recorded by 250-ms voltage ramps from −160 to +20 mV from a holding potential of 0 mV in response to the application of a high-K+ solution of the following composition (in mM): NaCl 5, KCl 140, CaCl2 2, MgCl2 1, Hepes 20, and glucose 10 (pH 7.4 with NaOH). The control bath solution contained (in mM) NaCl 160, KCl 2.5, CaCl2 2, MgCl2 1, Hepes 10, and glucose 8 (pH 7.4 with NaOH). The intracellular solution contained (in mM) KCl 175, MgCl2 5, Hepes 5, BAPTA 0.1, K2ATP 3, and NaGTP 0.1 (pH 7.2 with KOH). (B) Examples of traces showing the effects of ZnPy (1–10 μM) on Kir2.3 currents recorded as in A. (C) Summary of the experiments presented in B; maximal inward current amplitude at −160 mV is analyzed. The number of cells is indicated within the bars. Asterisks denote a significant difference from the control; *P < 0.05 and ***P < 0.001 (repeated measures ANOVA). (D) Effect of ZnPy on Kv1.4. Shown are examples of current traces recorded using whole-cell patch-clamp from the HEK293 cells transfected with Kv1.4 (YouBio) and GFP in control conditions and in the presence of 10 μM ZnPy. The voltage protocol is depicted below the traces. Recording solutions were as follows: The external solution contained (in mM) NaCl 140, KCl 5.4, CaCl2 2, MgCl2 1.0, Hepes 10, and glucose 10 (pH 7.3 with NaOH); the intracellular solution contained (in mM) KCl 140, Mg-ATP 4, MgCl2 1, CaCl2 1, and Hepes 10 (pH 7.4 with KOH). (E) Summary of the experiments in D. The number of cells is indicated within the bars. Asterisks denote a significant difference from the control; ***P < 0.001 (paired t test).

