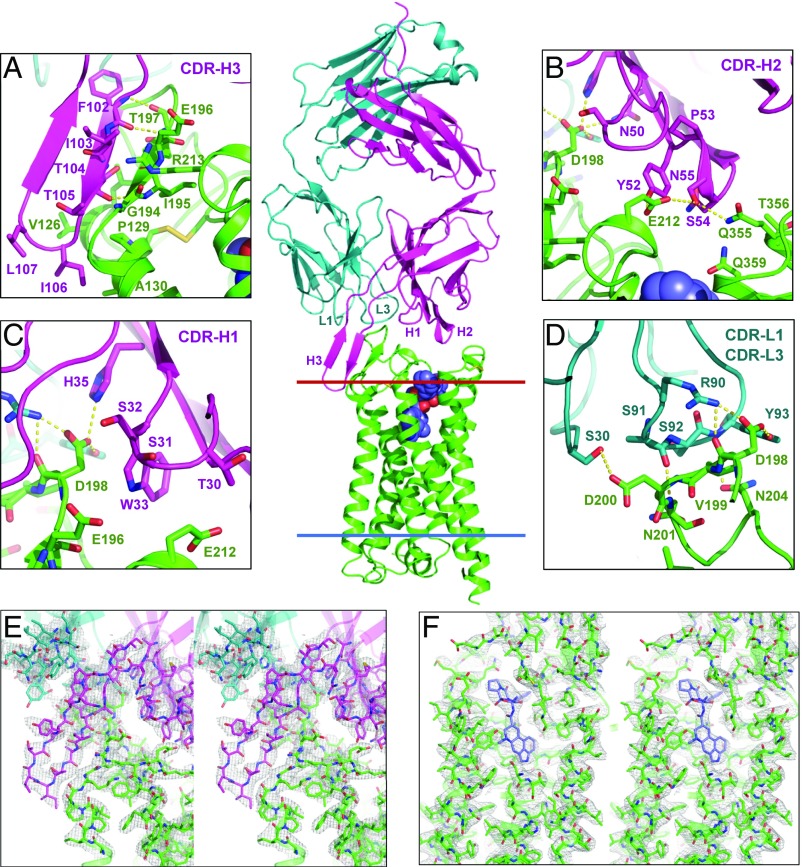
Fig. 1.
Structure of the complex between 5-HT2B/ERG and an antibody Fab fragment. Overall view of the complex with 5-HT2B (green), Fab light chain (teal), and Fab heavy chain (magenta). Red and blue lines indicate the extracellular and intracellular membrane boundaries, respectively, as defined in the Orientation of Proteins in Membranes database (opm.phar.umich.edu/). The ligand ERG is shown as spheres with carbon atoms colored blue. Zoom-in panels show details of interactions between the receptor and (A) CDR-H3, (B) CDR-H2, (C) CDR-H1, and (D) CDR-L1 and CDR-L3 of the P2C2–Fab. Hydrogen bonds and salt bridges are shown as yellow dash lines. Stereo views of 2mFo–DFc electron density maps contoured at 1 σ (gray mesh) for the interaction region between CDR-H3 of Fab and ECL2 of 5-HT2B (E) and for the ligand-binding pocket (F).

