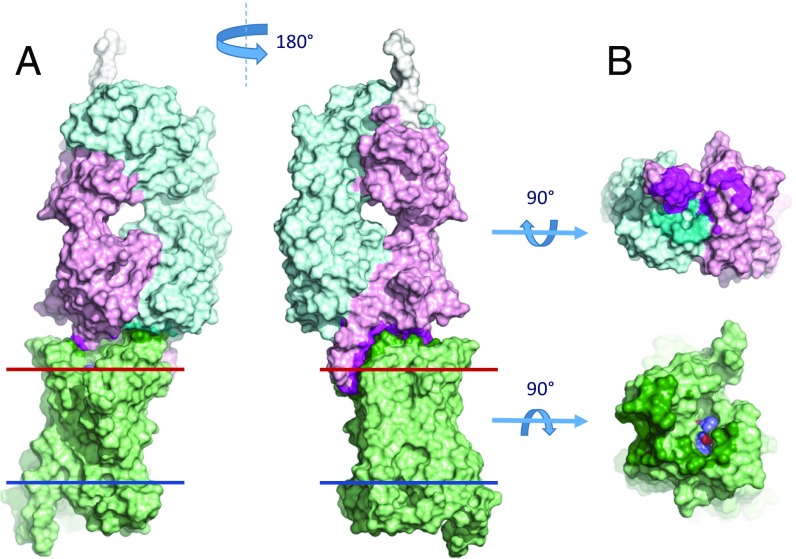
Fig. 2.
Overall structure of the 5-HT2B/ERG-Fab complex and the binding interface between Fab and 5-HT2B/ERG. (A) Two side views of the 5-HT2B/ERG-Fab complex in a surface representation. Red and blue lines correspond to the extracellular and intracellular membrane boundaries respectively, as defined in the Orientation of Proteins in Membranes database (opm.phar.umich.edu/). (B) Interacting surfaces of 5-HT2B/ERG and Fab. 5-HT2B receptor is shown in light green, ERG is shown as spheres with blue carbons, Fab heavy chain is in light magenta, Fab light chain is in light cyan. Interacting residues are highlighted in bold colors.

