Fig. S3.
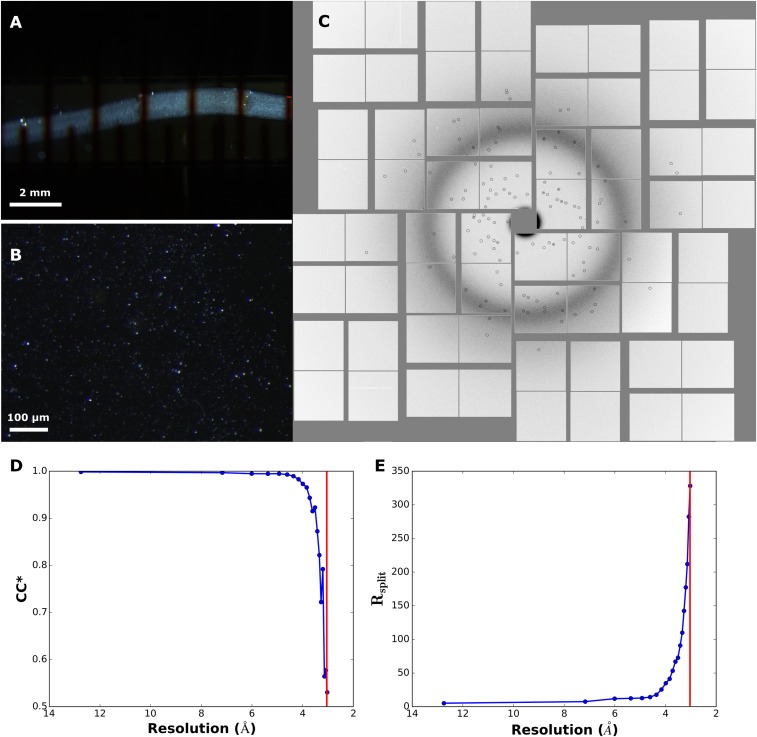
Crystallization of 5-HT2B/ERG-Fab and crystallographic data collection. (A) Microcrystals inside LCP string in a gas-tight Hamilton syringe viewed under cross-polarized light. (B) Microcrystals in LCP sandwiched between two glass slides viewed under cross-polarized light. (C) Example of a diffraction image on Cornell-SLAC Pixel Array Detector. Diffraction spots identified by Cheetah (33) are circled. (D) Dependence of correlation coefficient (CC*) on resolution. (E) Dependence of Rsplit on resolution. Data cut-off at 3.0 Å is shown as a red line in D and E.

