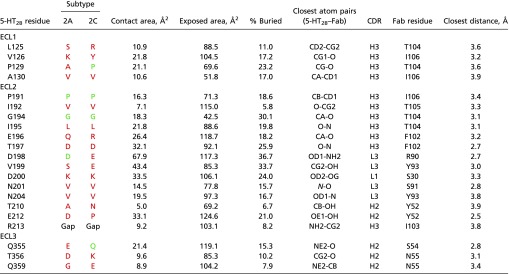
Table S2.
Interactions between the 5-HT2B receptor and Fab chains: Complex composed of chains A, B, and C
 |
For each receptor residue only the closest interaction is shown. Residues in 2A and 2C subtypes identical to residues in 2B are colored green, different residues are colored red.
