Fig. 2.
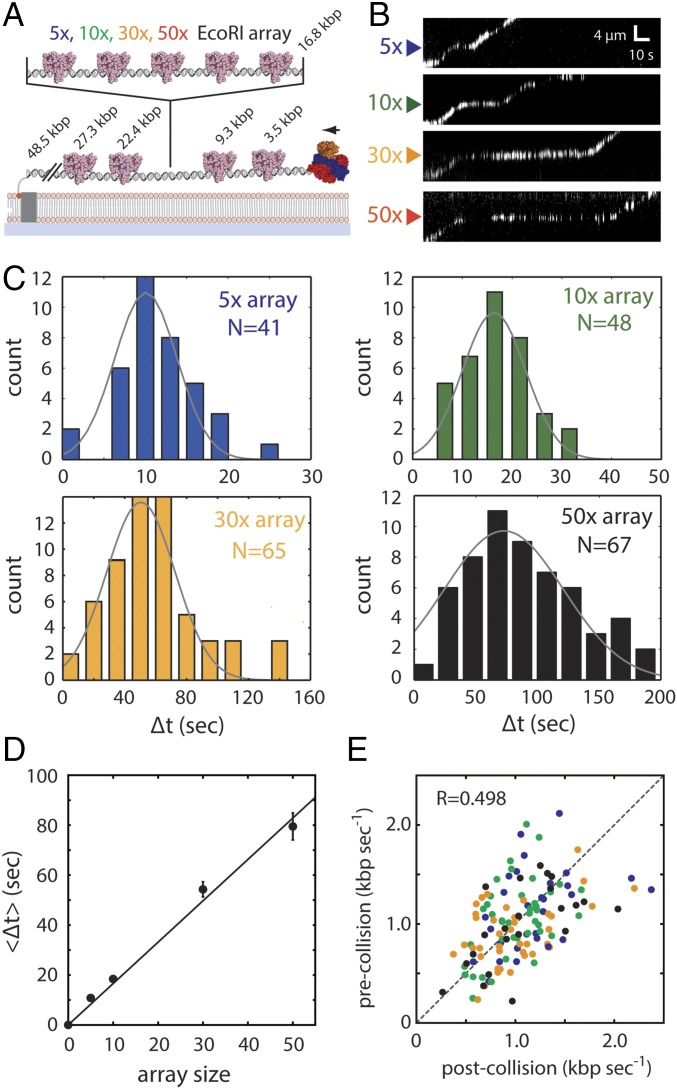
RecBCD can traverse highly crowded DNA substrates. (A) Schematic of the DNA curtain assay used to assess RecBCD behavior during passage through protein arrays. The DNA contains four native EcoRI binding sites (as indicated) and a cloned array of 5–50× EcoRI binding sites. The reactions were initiated by addition of 1 mM ATP into the RecBCD buffer (40 mM Tris⋅HCl, pH 7.5, 2 mM MgCl2, 0.2 mg mL–1 Pluronic). (B) Representative kymographs showing RecBCD movement through 5–50× arrays in the presence of saturating EcoRIE111Q. Gaps in the RecBCD trajectories result from Qdot blinking. (C) Experimentally observed pause distributions for each array. Each dataset is fitted by a Gaussian distribution to derive the average pause duration. (D) Experimental pause duration () plotted against array size. Error bars represent SD derived from a bootstrap analysis. The sums of squared residuals for best fit curves are 29.3 (seconds2) for the linear equation and 422.1 (seconds2) for the exponential equation, suggesting that the linear equation fits better than the exponential equation. (E) Scatter plot showing RecBCD pre- and postcollision velocities; color coding is the same as in C and E. R represents the Pearson correlation coefficient.

