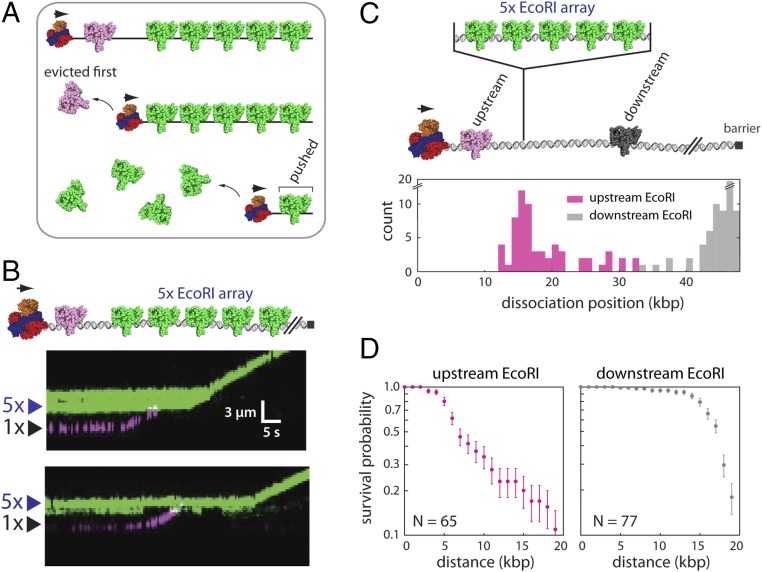
Fig. 4.
Sequential eviction of EcoRI from DNA by RecBCD. (A) A model describing the predicted outcome for two-color labeling experiments designed to test for sequential protein eviction by RecBCD; details are presented in the text. (B) Examples of two-color kymographs showing Qdot-tagged EcoRIE111Q (Qdot 705; magenta) being pushed into a 5× array bound by Qdot-tagged EcoRIE111Q (Qdot 605; green). Reactions were initiated by addition of 1 mM ATP into the RecBCD buffer (40 mM Tris⋅HCl, pH 7.5, 2 mM MgCl2, 0.2 mg mL–1 Pluronic). Gaps in the EcoRIE111Q traces result from Qdot blinking. (C) Schematic illustration of the experiment used to assess the fate of EcoRIE111Q bound to native target sites in the λ-DNA located either upstream or downstream of the 5× EcoRI array (Upper) and the resulting dissociation positions of the upstream and downstream EcoRIE111Q molecules (Lower). (D) Survival probability plots for EcoRIE111Q molecules located upstream and downstream of the 5× EcoRI arrays. The horizontal axis represents the distance from the original EcoRI binding position. The error bars represent SDs calculated by bootstrap analysis.

