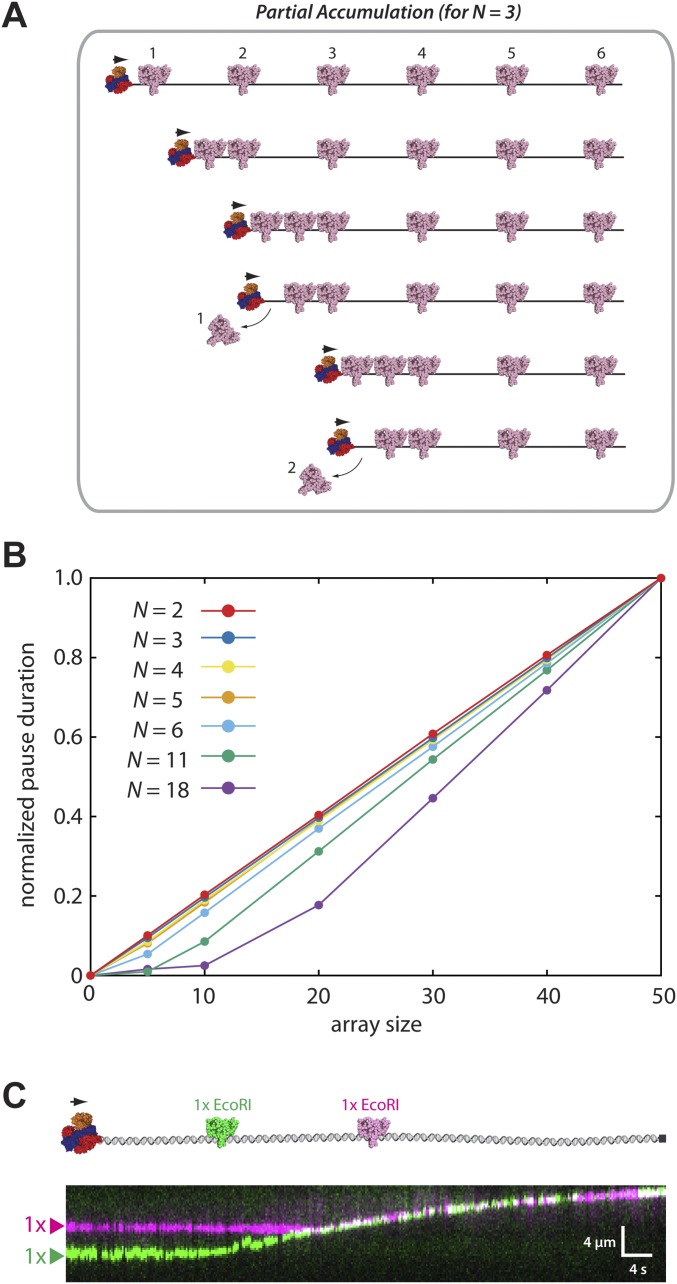
Fig. S1.
KMC simulations of the alternative sequential dissociation model. (A) Schematic illustration of a hybrid model invoking components of both accumulation and sequential eviction. In this example, three proteins accumulate () before dissociation. Additional details of this model are presented in Materials and Methods. (B) Pause duration distributions () for simulations involving differential numbers of accumulated proteins () for each different array size as indicated. We fit the data for n = 5 with the linear and exponential equations. The sums of squared residuals for best fit curves are 0.2 (seconds2) for the linear equation and 221.9 (seconds2) for the exponential equation, suggesting that the linear equation fits better than the exponential equation. (C) Experimental schematic and kymograph showing that RecBCD (unlabeled) can push two molecules of differentially labeled EcoRIE111Q.

