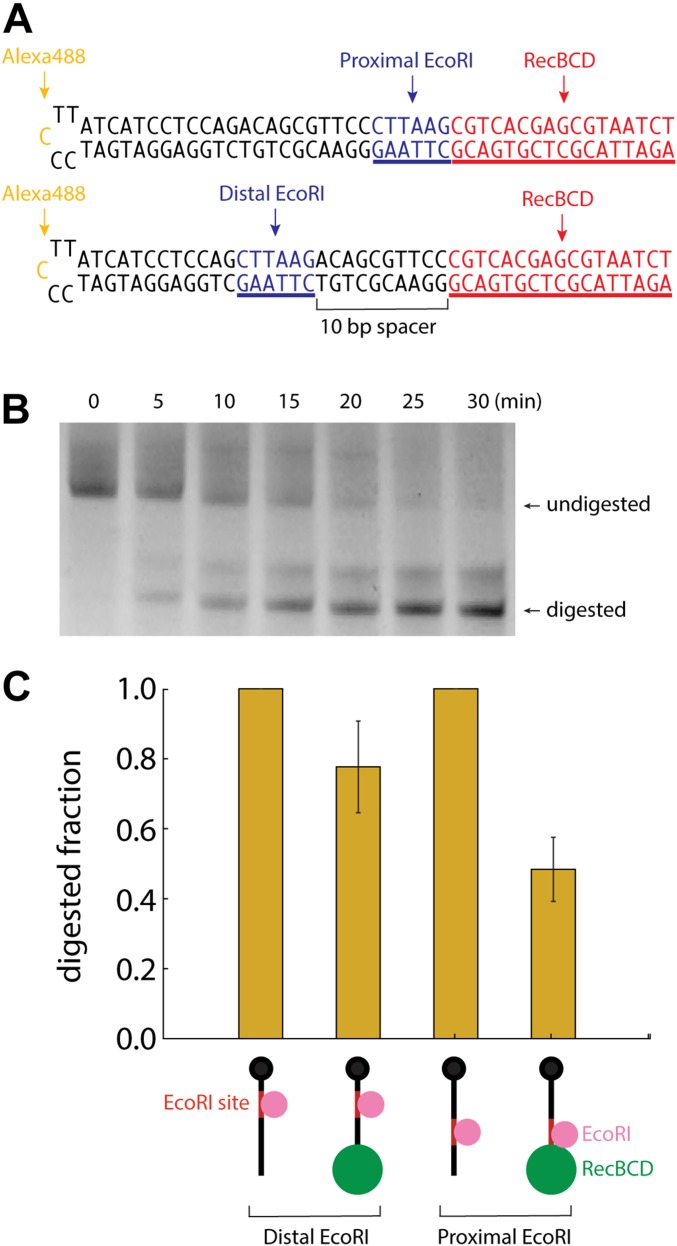
Fig. S7.
Digestion of DNA oligonucleotides by WT EcoRI in the presence and absence of RecBCD. (A) Schematic of the oligonucleotide substrates containing proximal and distal EcoRI binding sites. The EcoRI binding sites are shown in blue, and the RecBCD binding site is shown in red. (B) An example denaturing gel showing a time course of EcoRI digestion in the presence of (static) RecBCD. (C) The normalized signal intensity of digested fraction at 30 min is plotted for each substrate in the presence and absence of RecBCD. Error bars represent SD calculated from three independent experiments. In the cartoon depictions, the DNA is black, EcoRI binding sites are red, EcoRI is magenta, and the RecBCD molecules are green.

