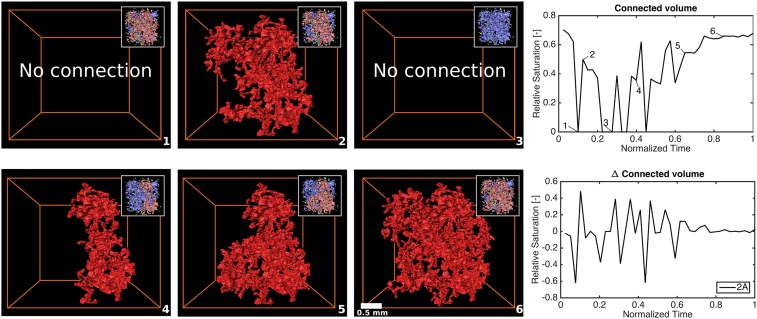
Fig. 4.
Volume of N2 instantaneously connected from inlet to outlet. In graphs, connected volume of N2 as a percent of total N2 saturation and the relative change in connected volume with time are plotted for experiment 2A. Images show volume rendering of N2 for experiment 2A (numbers 1 to 8). The connected volume of N2 is shown in red. (Insets) Ganglia split by size: small (green), medium (blue), and large (pink) ganglia. Flow is from top to bottom.

