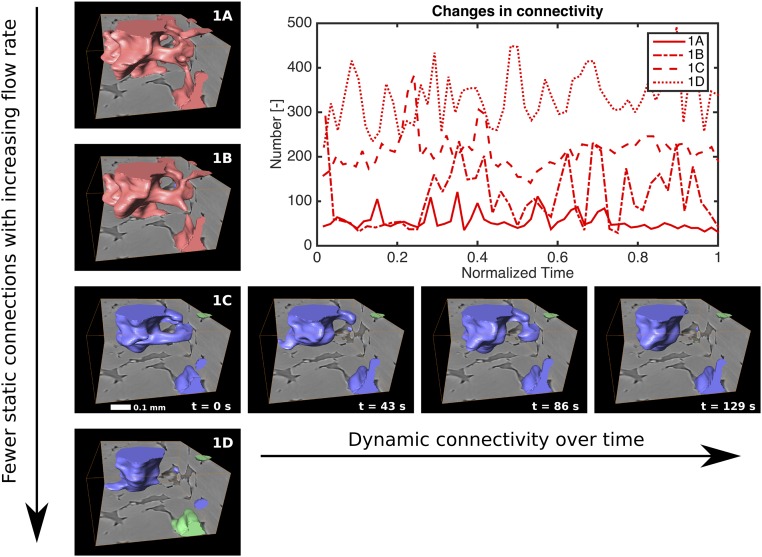
Fig. 5.
Change in connectivity with flow rate and time. Volume renderings of N2 ganglia, colored by size, in a 720 720 360 m subvolume are shown for experiments 1A to 1D. Four consecutive time steps are shown for experiment 1C, illustrating two continuously filled pores and several transient branching connections. Also shown is the number of connections through pore throats in the whole imaged volume versus time. The volume of N2 shown in the images is connected both inside and outside the subvolume.

