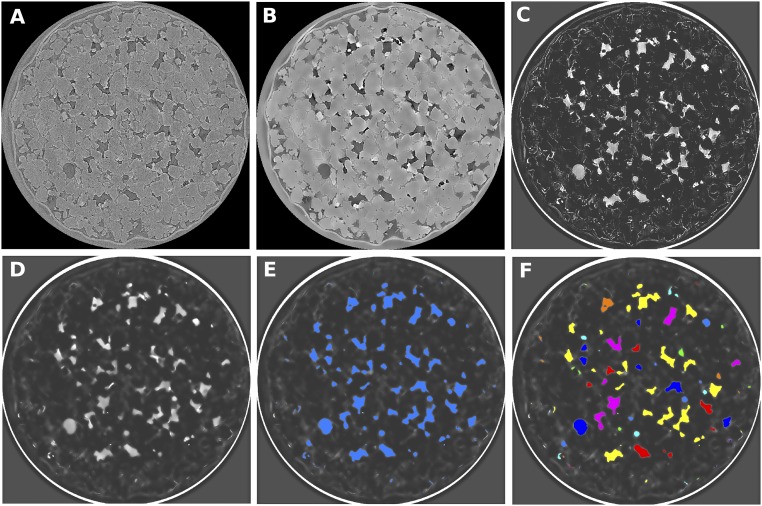
Fig. S2.
Examples of the steps used to process the synchrotron data and extract volumes of N2. Each image has dimensions 4 mm 4 mm. (A) Raw grayscale image. (B) Image after undergoing nonlocal means filtering, registration to a dry scan, and resampling to align the registered voxels. (C) Difference image created by subtracting a brine scan from the experimental scan. (D) Nonlocal means filtered difference image. (E) Image where watershed segmentation algorithm has been used to identify N2 in blue. (F) Image where individual volumes of N2 have been labeled and colored separately.

