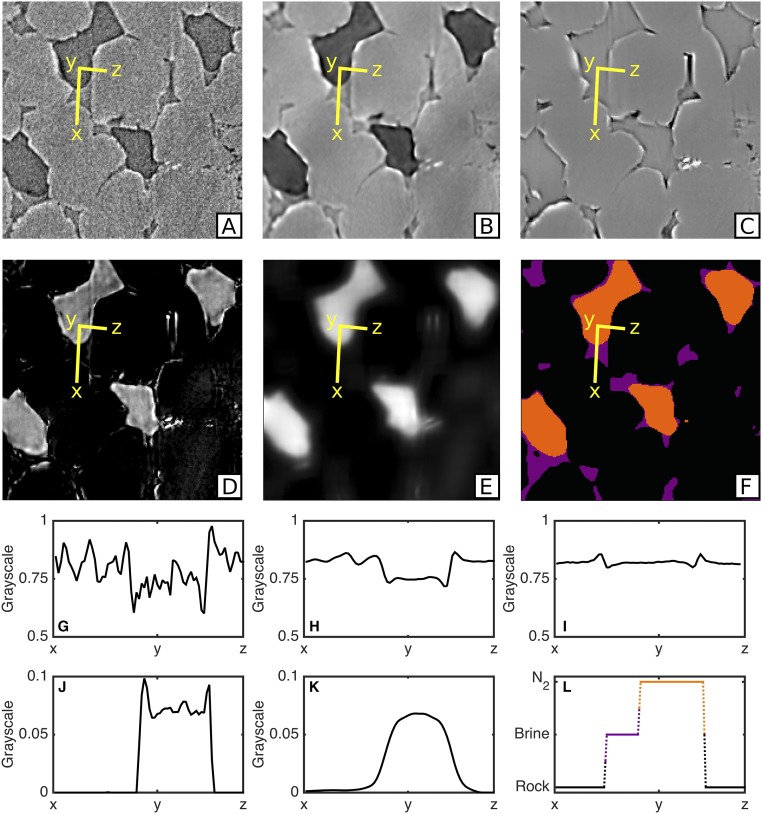
Fig. S3.
Images at six stages of processing (A–F) are shown along with scaled grayscale profiles across x–y–z (G–L) to illustrate the change in grayscale such that three different phases can be identified (F and L). Each image has dimensions 300 m 300 m (A and G) Raw reconstructed image. (B and H) Filtered image. (C and I) Filtered image (brine only). (D and J) Difference image between B and C. (E and K) Filtered difference image. (F and L) Segmented image.

