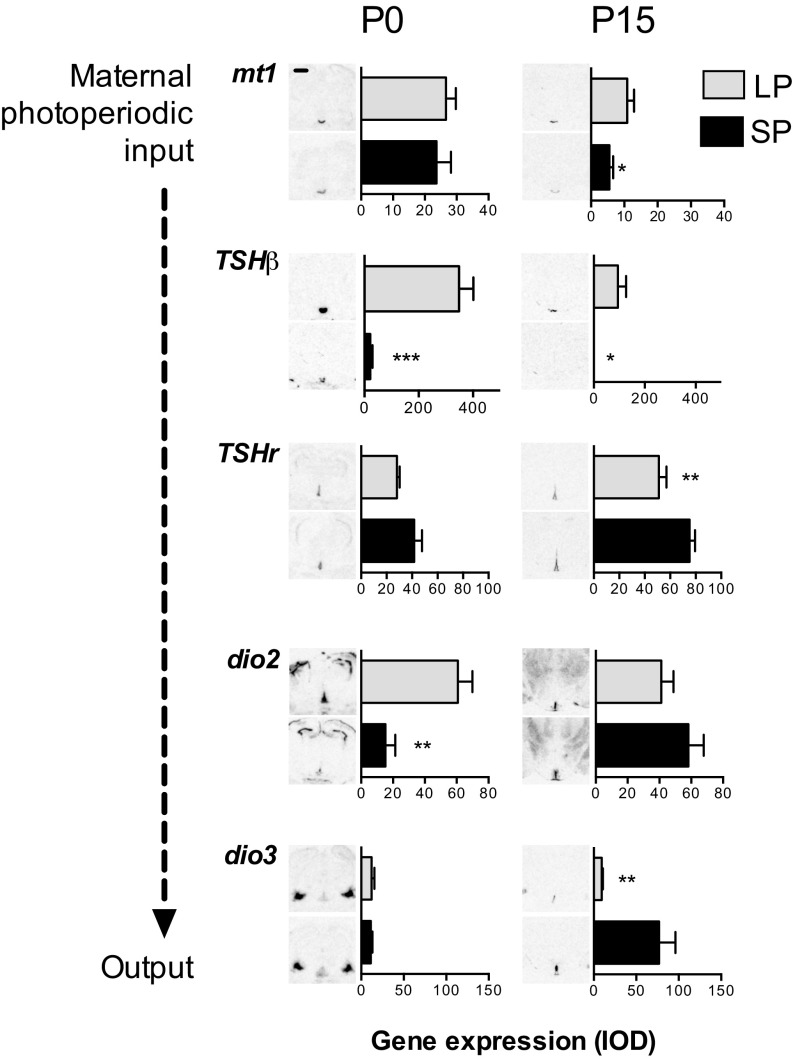
Fig. 1.
Effects of maternal photoperiod exposure on brain and pituitary gene expression in the neonatal period. Gene expression is shown at postnatal day 0 (P0, Left) and at P15 (Right). For each gene, representative images from in situ hybridization are shown next to integrated optical density (IOD) measurements. (Upper) Type 1 melatonin receptor (mt1) and thyroid stimulating hormone subunit-β (TSHβ) in the pars tuberalis; (Lower) TSH receptor (TSHr), type 2 deiodinase (dio2) and type 3 deiodinase (dio3) in the tanycytes. Data are mean ± SEM of n = 6 individuals. Expression differs significantly between groups. *P < 0.05, **P < 0.01, ***P < 0.001. (Scale bar, 0.5 mm.)

