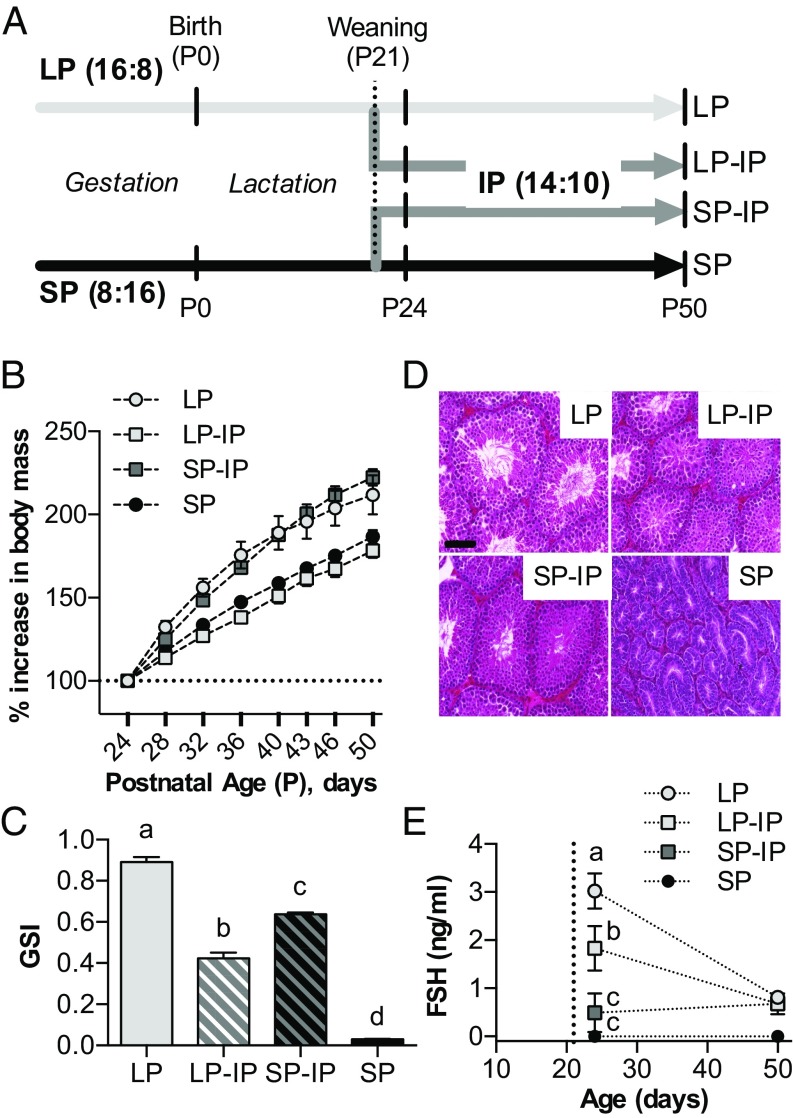
Fig. 2.
Effects of photoperiodic history on growth and testicular development. (A) Schematic representation of the timeline and photoperiodic conditions of the experiment. Small vertical bars indicate sampling points for tissue collection. LP = 16 h light/24 h for whole study, SP = 8 h light/24 h for whole study. LP-IP, SP-IP = transfer to 14 h light/24 h at weaning, from LP and SP, respectively. P, postnatal day. (B) Graph depicting offspring increase in body mass from P24 to P50. (C) Offspring gonadosomatic index (GSI) at P50. Data are mean ± SEM of n = 12–14 individuals. (D) Hemotoxylin and eosin-stained testis sections from P50 animals. (Scale bar, 100 μm.) (E) Serum FSH levels following weaning. The vertical dotted line indicates the weaning date (P21). Data are mean ± SEM of n = 6 individuals. Different letters indicate significant differences between groups (P < 0.05).

