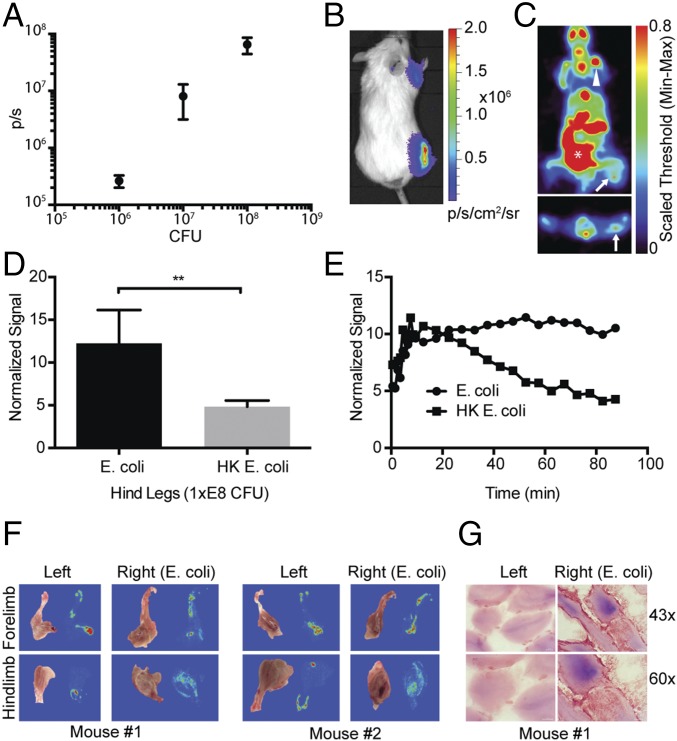
Fig. 4.
Limits of detectability of E. coli infection in vivo. (A) Live bioluminescent E. coli were injected intramuscularly (i.m.) into the right hindlimb (1 × E8 cfu), right forelimb (1×E7), and ear pinna (1 × E6) of BALB/c mice, whereas heat-killed (HK, 95 °C for 20 min) E. coli were injected into the contralateral limb. The graph shows colony-forming units (x axis, cfu) versus bioluminescent light flux (p/s). Error bars represent the SD (n = 3). (B) Representative bioluminescent image of data from A. (C) Transverse and coronal images of a representative mouse after [18F]FPTMP, ∼200 μCi i.v. at 90 min. Live bacteria (arrow), bone (arrowhead), and bowel (*) are identified. (D) Normalized signal from the hindlimb (lower leg, n = 3). P < 0.01 using a two-tailed student’s t-test. (E) Time-activity curve of uptake from the hindlimbs of a representative animal. (F) Autoradiography after in vivo administration of [18F]FPTMP of two animals from C. Diffuse uptake was seen in the musculature of the lower legs infected with live E. coli. (G) Bright-field microscopy of tissue gram stains of the infected and control lower legs at 40× and 63×. E. coli is a Gram-negative rod and stains a red/pink color.

