Fig. 6.
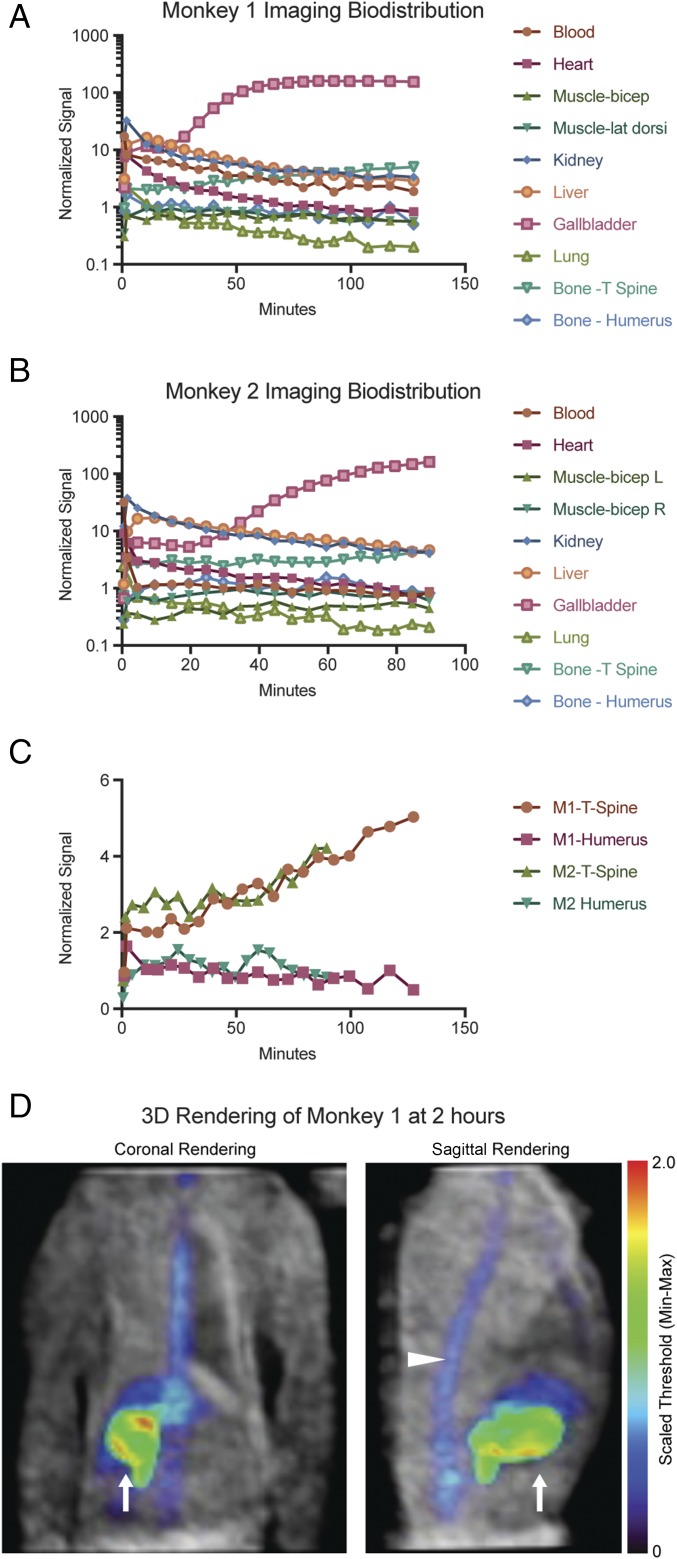
Imaging biodistribution in nonhuman primates. (A and B) Two rhesus monkeys were injected with [18F]FPTMP 1–2 mCi i.v. and a graphical imaging biodistribution over time is shown. Regions of interest within tissues were quantified and normalized to injected weight and dose. (C) Focused graph of normalized signal over time in the spine and humerus of both monkeys. (D) The grayscale image represents the transmission data of monkey 1, and the NIH color scale represents [18F]FPTMP at 2 h. Images of the thorax and upper abdomen of the animal are presented in the coronal and sagittal plane. Signal is seen predominately from the gallbladder (arrow) with a small component from the spine (arrowhead).

