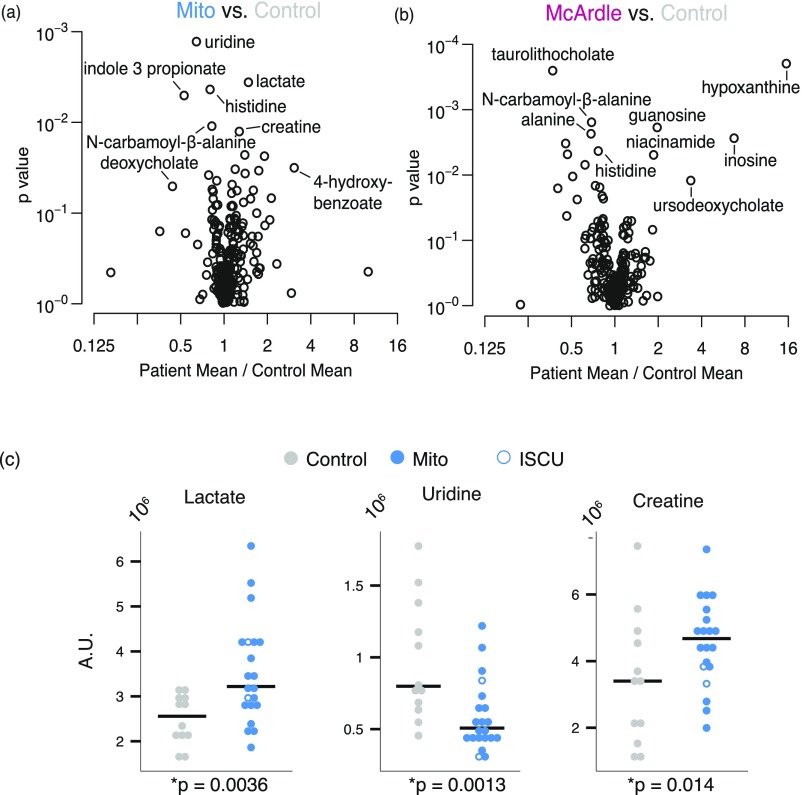
Fig. S3.
Individual group comparison and validation of biomarkers for mitochondrial disease. (A and B) Volcano plots showing the spectrum of metabolic differences in the pairwise comparisons between (A) Mito patients vs. controls and (B) McArdle patients vs. controls. The x axis shows the ratio of the mean patient value to the mean control value, plotted against the p value for the test of equal means in both groups. (C) Resting measurements of lactate, uridine, and creatine that were identified both in this study and previous studies as distinguishing Mito from control.

