Fig. 2.
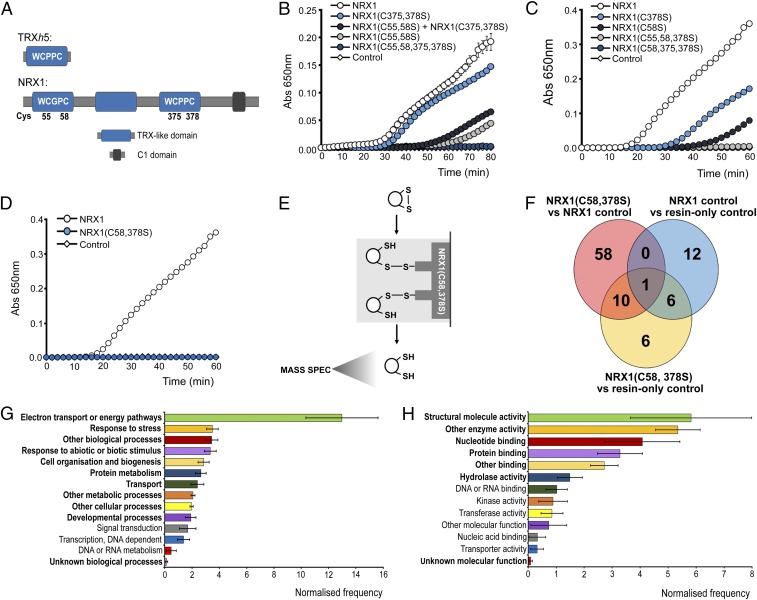
Identification of substrates of NRX1 oxidoreductase activity. (A) Unique domain structures of AtNRX1 compared with AtTRXh5, a conventional immune-inducible TRX. (B–D) Oxidized insulin (130 µM) was incubated with 0.3 mM DTT either alone (control) or together with 6 µM native NRX1 or indicated NRX1 active-site mutants. Formation of reduced insulin was measured at 650 nm. Error bars indicate SD (n = 3). (E) Schematic of NRX1 substrate capture experiment, using immobilized mutant NRX1(C58,378S). (F) Venn diagram illustrating proteins identified in the substrate capture experiment. Each circle represents proteins found to be enriched (P < 0.05, ratio > 1.5) in one of the following comparisons between columns: NRX1(C58,378S) column compared with WT NRX1 control column (pink); NRX1(C58,378S) column compared with resin-only control column (yellow); WT NRX1 control column compared with resin-only control column (blue). (G and H) GO term analysis was performed on the 74 targets enriched in the immobilized NRX1(C58,378S) mutant column for biological process (G) and molecular function (H) using Classification Superviewer on bar.utoronto.ca/. Normalized frequencies, SD, and P values were determined from absolute values as described in ref. 36. Error bars represent SD. P ≤ 0.05 are printed bold.

