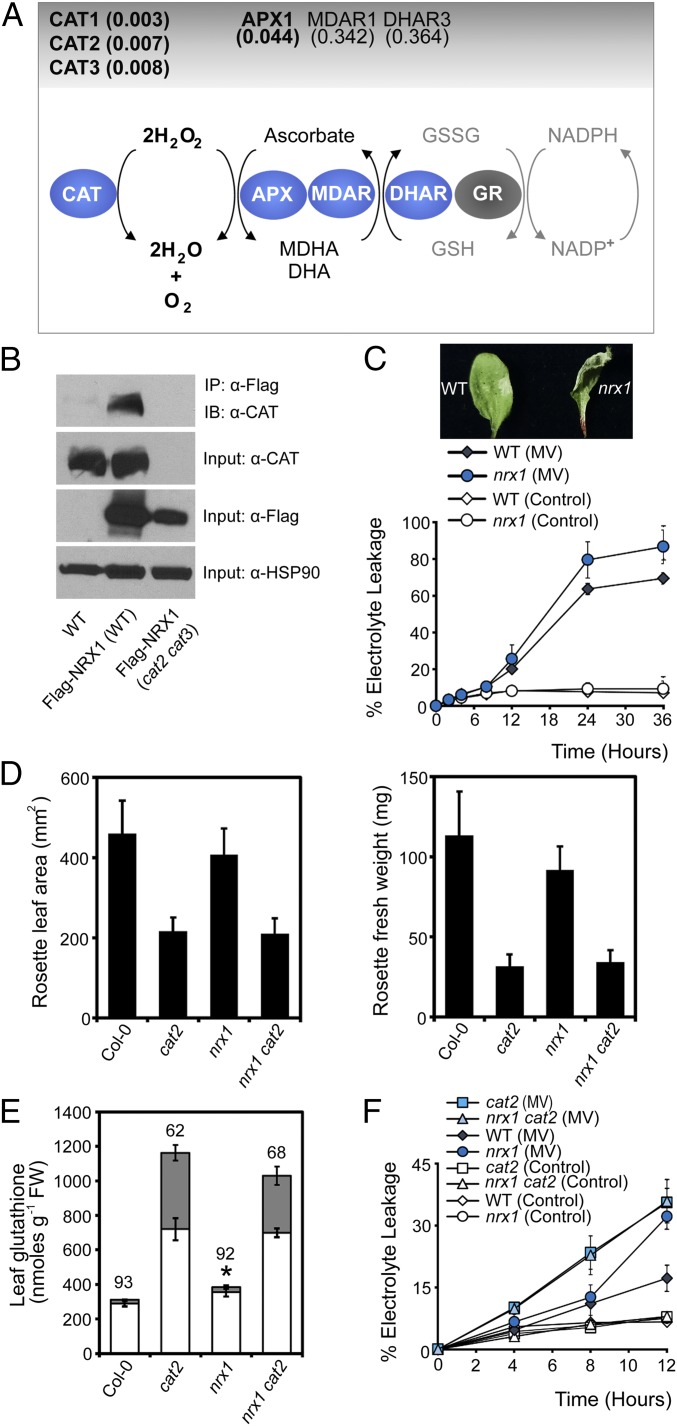
Fig. 3.
NRX1 protects plant cells from oxidative stress. (A) Diagram of the major H2O2-scavenging pathways. Enzymes enriched in the immobilized NRX1(C58, 378S) column are indicated in blue ovals and P values indicated above. (B) WT, 35S::Flag-NRX1 (Col-0), and 35S::Flag-NRX1 (cat2-2 cat3-1) plants were infected with Psm ES4326 (5 × 10⁵ cells). Total protein was extracted under denaturing conditions and with the alkylating agent NEM to prevent nonspecific disulfide formation. Flag-NRX1 was immunoprecipitated and analyzed by Western blotting using an anti-CAT antibody. Anti-FLAG and anti-HSP90 were used as input controls. (C) Leaves were infiltrated with 5 µM MV or ddH2O (control). Electrolyte leakage was measured as a percentage of total electrolytes. Error bars represent SD (n = 3). Photographs were taken at 6 h. (D) Rosette leaf area (Left) and fresh weight (Right) were measured in 3-wk-old plants. Error bars represent SD (n = 20). (E) Total leaf glutathione of leaves. Asterisks indicate a significant difference (P ≤ 0.05) between total glutathione levels of WT and nrx1 plants. Reduced and oxidized glutathione levels are indicated by white and gray bars, respectively. The percentage reduction state of glutathione is indicated above bars. Error bars represent SD (n = 3). (F) Leaves were infiltrated with 5 µM MV or ddH2O (control). Electrolyte leakage was measured as a percentage of total electrolytes. Error bars represent SD of the mean (n = 3).

