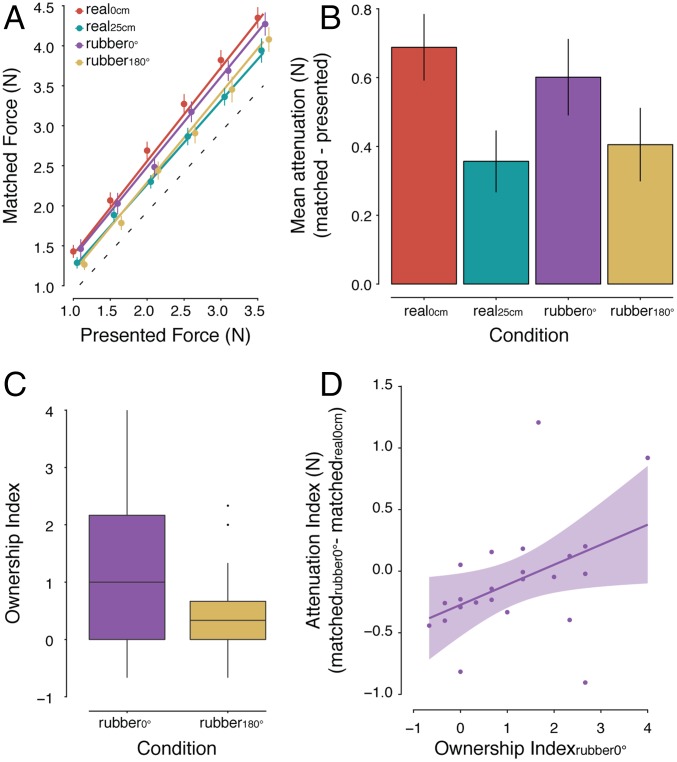
Fig. 2.
Results of experiment 1. (A) Forces generated by participants (matched forces) as a function of the forces generated externally by the motor (presented forces) (mean ± SE across participants). The dotted line indicates the theoretically perfect performance. The colored lines represent the fitted regression lines per condition. For illustration purposes, the position of the markers has been adjusted to the right to avoid overlapping points. (B) Mean force attenuation (matched forces – presented forces) across participants per condition. The forces participants applied in the rubber0° (purple) condition were significantly stronger than those in the rubber180° (yellow) or real25cm (cyan) condition, even though the distance between the participants’ hands was identical in all three conditions. In contrast, the forces applied in the rubber180° (yellow) condition did not significantly differ from those in the real25cm (cyan) condition. (C) The strength of the rated ownership of the rubber hand shown as boxplots for the two conditions. As can be seen, the illusion was significantly stronger when the rubber hand was congruently oriented. The horizontal black bars represent the medians, and the boxes denote the interquartile ranges and extend from the first (Q1) to the third (Q3) quartile. Whiskers represent Q1 – 1.5 × IQR and Q3 + 1.5 IQR, respectively. Data beyond the end of the whiskers are plotted as individual data points. (D) Regression plot (and 95% confidence bands) showing that the stronger the ownership participants experienced toward the congruent rubber hand (ownership index), the stronger the attenuation of the self-generated forces (attenuation index). An attenuation index of zero indicates that the attenuation in the rubber0° condition is of the same magnitude as the attenuation during the real0cm condition.

