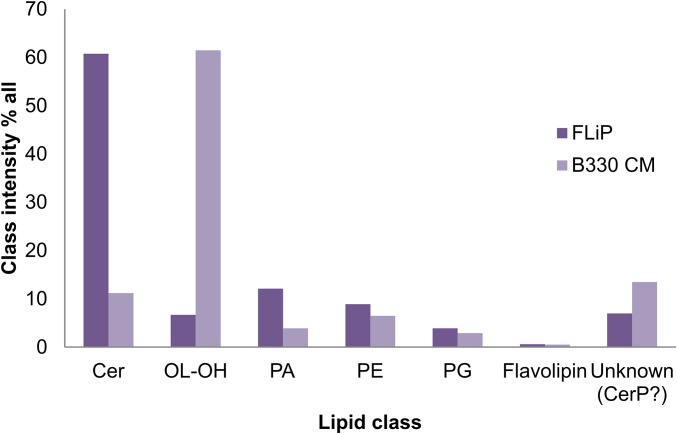
Fig. S2.
Comparison of lipid class intensities between the host cytoplasmic membrane (CM) and the FLiP membrane. Class intensity percentage of each lipid class identified by mass spectrometry from Flavobacterium sp strain B330 cytoplasmic membrane compared with that of the FLiP membrane. Cer, ceramide; CerP, ceramide 1-phosphate; OL-OH, ornithine lipid; PA, phosphatidic acid; PE, phosphatidylethanolamine; PG, phosphatidylglycerol.

