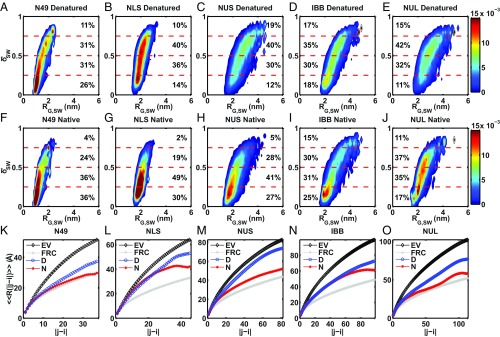
Fig. 4.
Quantification of the shape (δ*SW), size (RG,SW), and scaling of simulated ensembles reweighted to match both <EFRET> and RG,U2 for native and denatured conditions. (A–E) Two-dimensional histograms of RG,SW vs. δ*SW extracted from simulated ensembles reweighted to match both <EFRET> and RG,U2 for denatured conditions. (F–J) Two-dimensional histograms of RG,SW vs. δ*SW extracted from simulated ensembles reweighted to match both <EFRET> and RG,U2 for native conditions. The percentages indicate the percentage of δ*SW that falls between different δ*SW limits (dashed horizontal lines). For all IDPs studied, δ*SW increases under denatured conditions, indicating that the ensembles become less spherical and more elongated. (K–O) Internal scaling plots comparing the native (N) and denatured (D) profiles from simulated ensembles reweighted to match both <EFRET> and RG,U2. FRC and EV denote the internal scaling profiles generated from the Flory random coil and excluded volume coil references, respectively. Error bars denote the SEM over three independent simulations.

