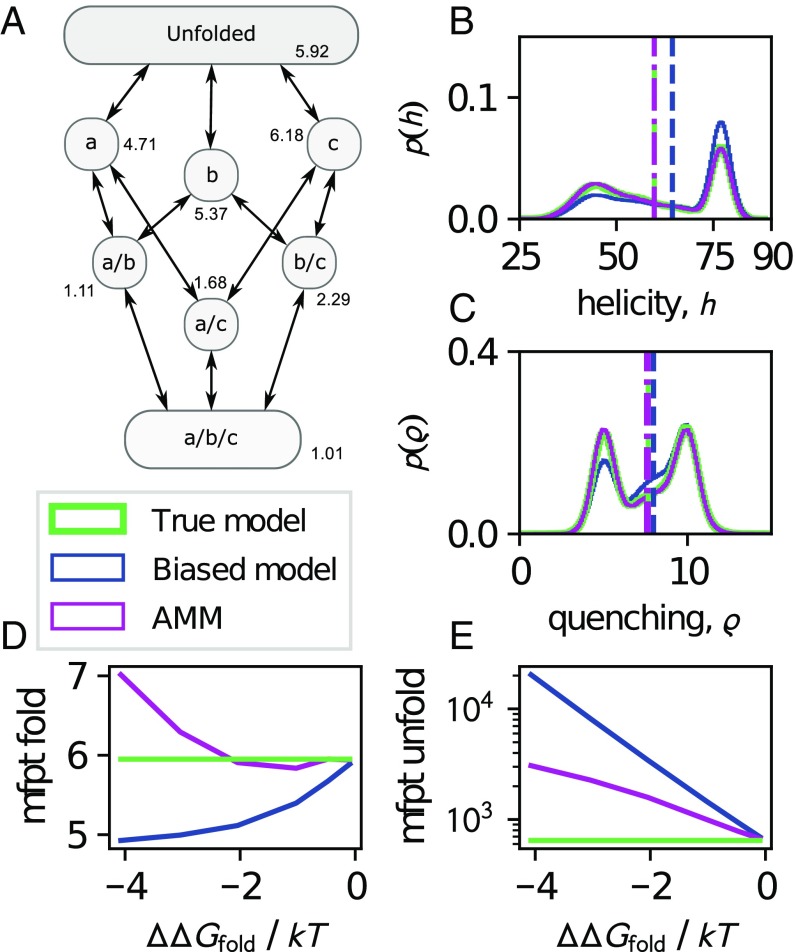
Fig. 2.
Illustration of AMMs on a protein-folding model with true thermodynamics and kinetics shown in green. A representative biased simulation with compared with the true model is shown in blue whereas the AMM-corrected values are shown in magenta. (A) Kinetic network topology. Each state is annotated by its true free energy in . (B and C) Equilibrium distributions (solid line) and expectation values (dashed/dashed-dotted lines) of helicity and fluorescence quenching observables. (D and E) Mean first passage times of folding and unfolding, respectively, of biased and AMM models as a function of the degree of bias, (Materials and Methods).

