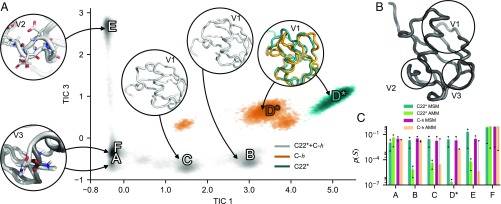
Fig. 3.
AMMs reconcile the equilibrium distributions simulated with different force fields. (A) Equilibrium density (log scale) sampled with C22* (teal) and C-h (orange) and both force fields (gray) as a function of the slowest and third-slowest TIC. A, Insets illustrate characteristic structural features in of metastable states = A, B, C, D*, E, and F determined using Perron-cluster cluster analysis (41). All but one Inset illustrate more than one metastable state (A and F). In the case of the A/F Inset, F is shown in dark gray and A in light gray. For D* a representative structure from each of the force fields is shown, colored as the equilibrium densities. (B) Viewpoints (V1, V2, and V3) used in Insets shown in A. (C) Comparison of the equilibrium probability () of metastable states in MSMs and AMMs. Sixty-eight percent CIs are shown as error bars.

