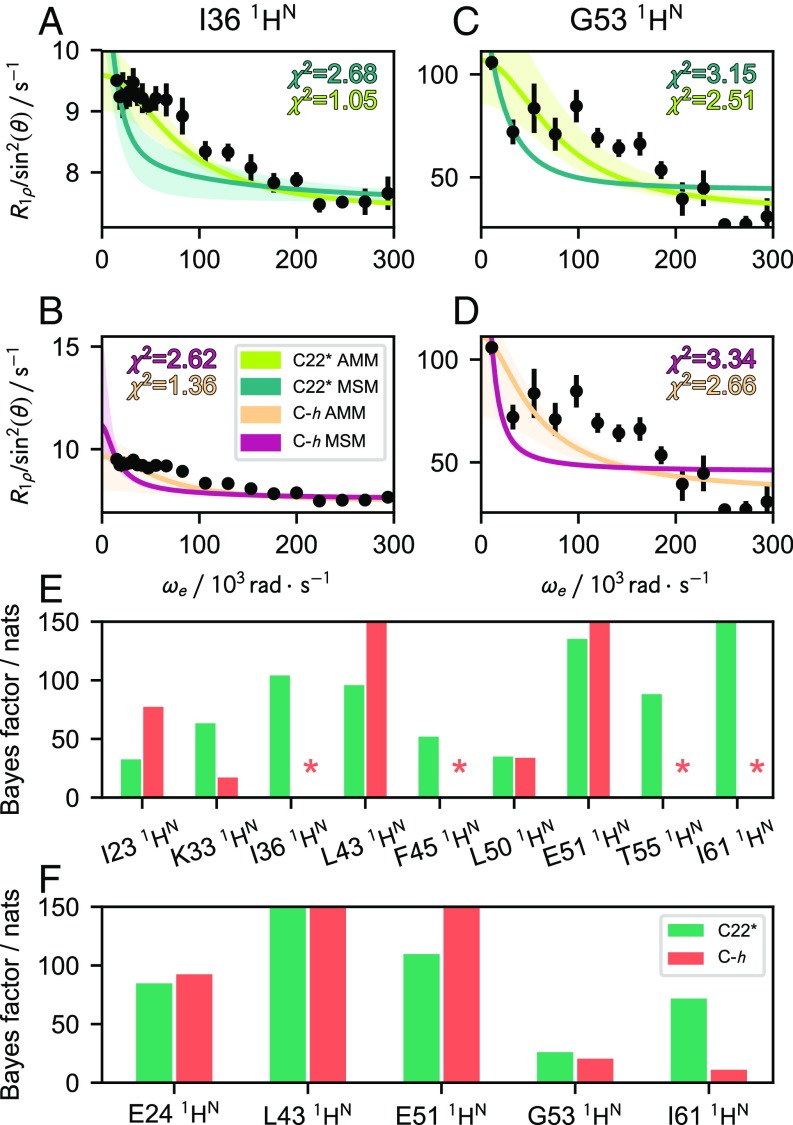
Fig. 4.
Comparison of relaxation dispersion predicted from MSMs and AMMs (14) with experiments at 292 K and 308 K (54). (A and B) Representative spin-relaxation profiles from of I36 at 292 K of AMMs and MSMs in C22* (A) and C-h (B). (C and D) Representative spin-relaxation profiles from of G53 at 308 K of AMMs and MSMs in C22* (C) and C-h (D). Shaded area corresponds to a 95% CI. (E and F) Improvement of AMMs relative to MSMs in reproducing spin-relaxation data at 292 K (E) and 308 K (F), measured by Bayes factors. y axes in E and F are truncated at (0, 150) for clarity. An asterisk (*) is shown for datasets where the AMM is not significantly better than the MSM (less than 4.6 nats).

