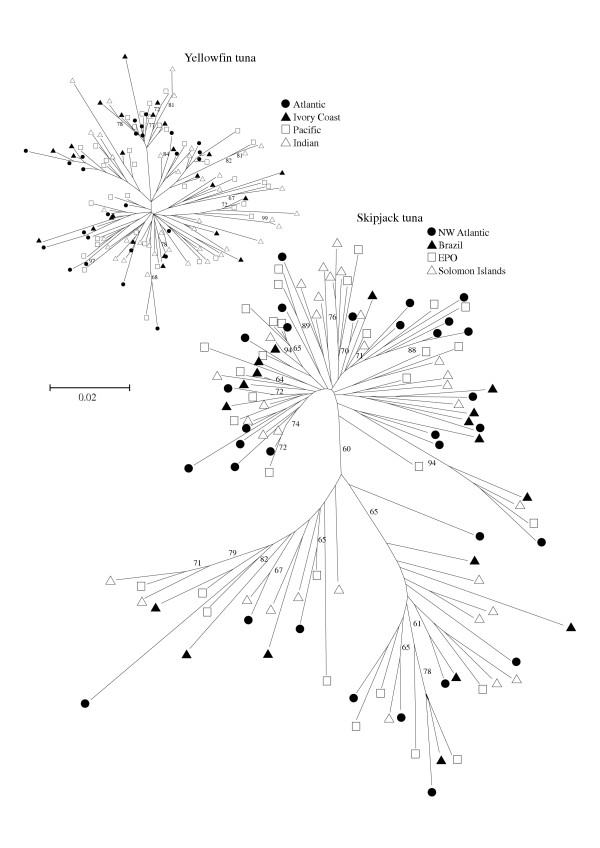
Figure 1.
Unrooted neighbor-joining (NJ) trees showing the relationship of 111 yellowfin tuna and 130 skipjack tuna haplotypes estimated from a matrix of Tamura Nei (α = 0.5) distances. Values of bootstrap proportion support above 60% are included and the geographical origin of haplotypes is identified with symbols (see inset). The bar indicates the size of a line representing differences of 2% with both trees drawn to the same scale.

