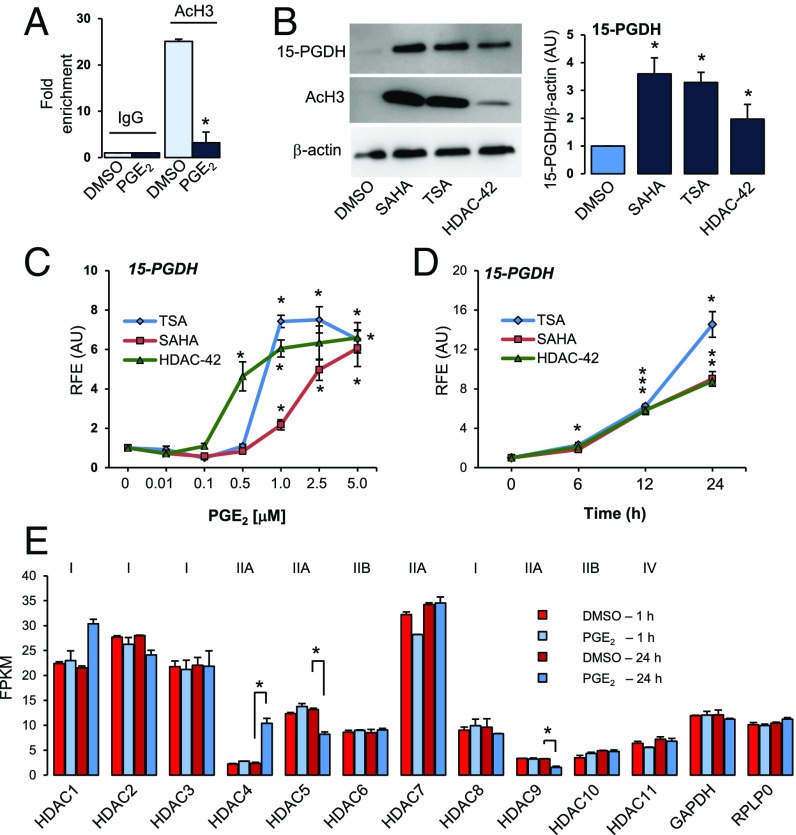
Fig. 3.
PGE2 results in deacetylation of chromatin associated with the 15-PGDH gene promoter. (A) Chromatin immunoprecipitation (IP) of acetylated histone H3 (AcH3) is compared with IP of IgG (negative control) in cells treated with DMSO or PGE2 (100 nM) for 24 h. Data represent average fold enrichment. *P < 0.05 compared with DMSO, Student’s t test. n = 3. (B) Representative immunoblot and quantitation of 15-PGDH levels in hCSCs treated with DMSO or HDACi SAHA (2.5 µM), TSA (1 µM), or HDAC-42 (1 µM) for 24 h. Acetylated histone H3(AcH3), positive control; β-actin, loading control. *P < 0.05 compared with DMSO, Student’s t test. n = 3. (C) Dose- (24 h) and time-dependent [SAHA (2.5 µM), TSA (1 µM), or HDAC-42 (1 µM)] increases in 15-PGDH after treatment with HDACi. *P < 0.05 compared with DMSO (C) or 0 time point (D), ANOVA, Dunn’s post hoc testing. n = 3. (E) Data represent fragments per kilobase of exon per million fragments mapped (FPKM) of class I, IIA, IIB, and IV HDACs expressed in hCSCs treated with DMSO or PGE2 (100 nM) for 1 or 24 h mined from the RNA-seq dataset. GAPDH and RPLP0 are shown as controls (1/100th FPKM values). *P < 0.05 compared with corresponding DMSO control.

