Fig. 4.
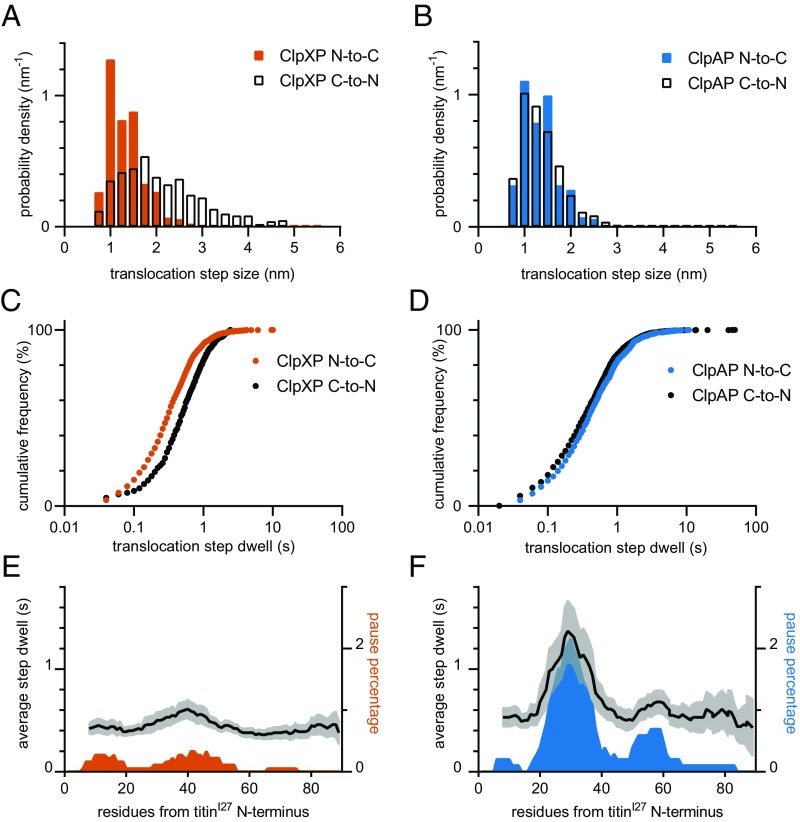
Steps during polypeptide translocation. (A and B) Distributions of physical step sizes during directional translocation by ClpXP (orange bars, A) and ClpAP (blue bars, B). Black bars show previously determined C-to-N step sizes for ClpXP (ref. 14, A) and ClpAP (ref. 15, B). (C and D) Distributions of dwell times preceding an individual step during N-to-C translocation are shown for ClpXP (orange symbols, C) and ClpAP (blue symbols, D). Black symbols show previously determined C-to-N step dwells for ClpXP (ref. 14, C) and ClpAP (ref. 15, D). (E and F) Average step dwells and frequency of pauses of 2.5 s or longer along the length of the titinI27 polypeptide during N-to-C translocation by ClpXP (E) or ClpAP (F) were calculated using a 10-aa moving window. The 95% CIs are shown in gray for average step dwells.

