Fig. 1.
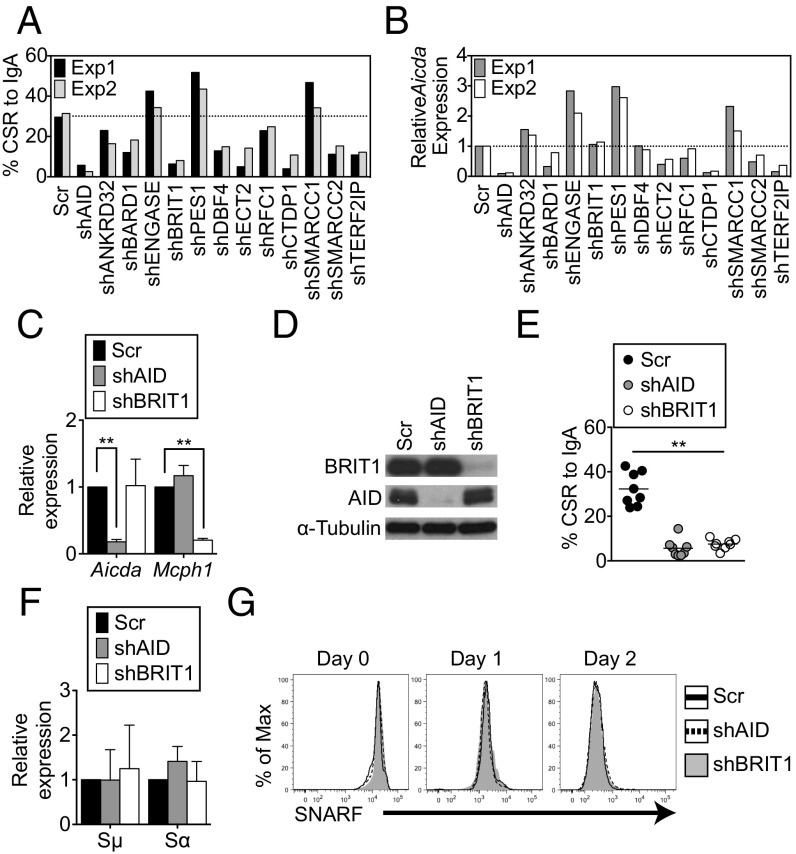
BRIT1 promotes CSR in CH12 cells. (A) CSR to IgA was assessed in CH12 cells retrovirally transduced with shRNA against indicated target genes. The dotted line represents the average CSR in cells transduced with Scr shRNA (n = 2). Exp, experiment; Scr, scrambled shRNA control. (B) Quantitative real-time PCR analysis of relative levels of AID mRNA (aicda) in each shRNA knockdown experiment. (C) Quantitative real-time PCR analysis of relative mRNA levels of AID and BRIT1 in CH12 cells retrovirally transduced with the indicated shRNAs. (D) Immunoblot analysis of whole-cell extracts of AID or BRIT1 knockdown cells using antibodies against BRIT1, AID, or α-tubulin (loading control). (E) CSR to IgA in shBRIT1 or shAID transduced CH12 cells (n = 8; **P < 0.005). (F) Real-time qPCR analysis of relative levels of Igμ and Igα germline transcripts in CH12 cells depleted for the indicated proteins. (G) Cell proliferation was assessed by staining cells with carboxylic acid acetate, succinimidyl ester (SNARF). One representative flow cytometry plot of SNARF dilution at different time points in live singlet-stimulated CH12 cells is shown (n = 6).

