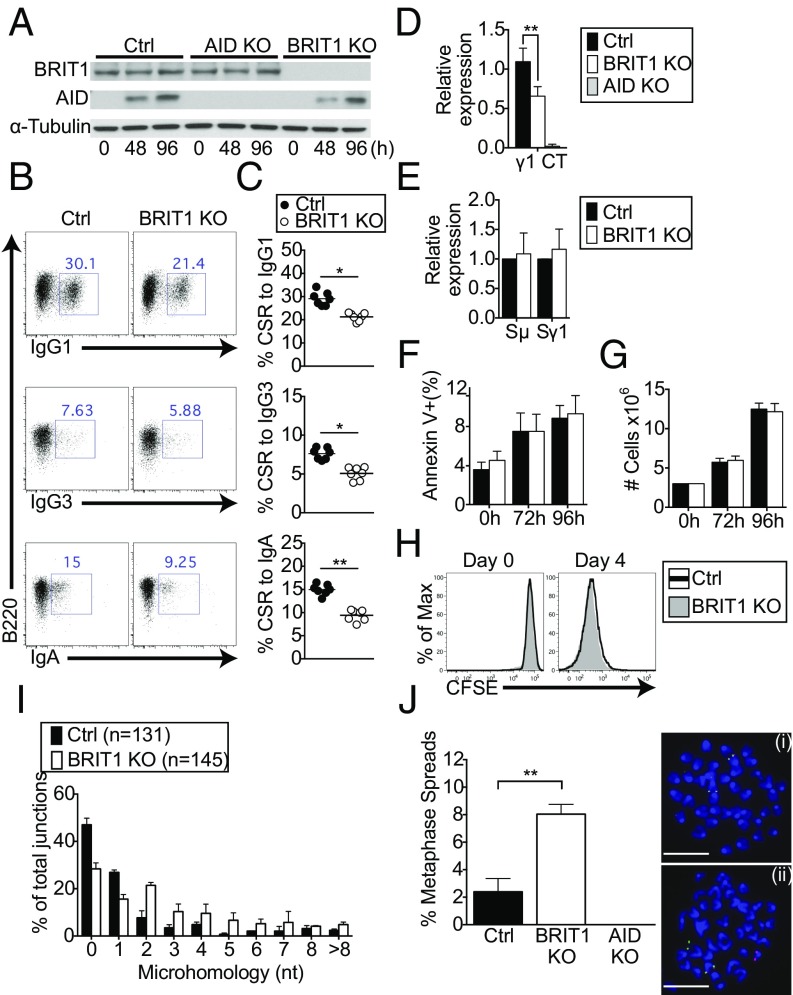
Fig. 2.
CSR is compromised in BRIT1-deficient splenic B cells. (A) Immunoblot analysis of BRIT1 and AID in whole-cell lysates of splenic B-cells from Mb1-Cre control (Ctrl) and BRIT1 KO mice (0 h, naive; 48 h and 96 h, LPS + IL-4 stimulation). (B) Representative flow cytometry of CSR to IgG1, IgG3, and IgA in splenic B cells from Mb1-Cre Ctrl and BRIT1 KO mice. (C) Quantification of CSR to IgG1, IgG3, and IgA in splenic B cells from Mb1-Cre Ctrl and BRIT1 KO mice. (n = 7; **P < 0.005). (D) Iμ–Cγ1 “circle” transcripts from looped out extrachromosomal DNA in splenic B cells activated with LPS + IL-4 were assessed by real-time qPCR. **P < 0.005. (E) Real-time qPCR analysis of relative levels of Igμ and Igγ1 germline transcripts in splenic B cells activated with LPS + IL-4 at 48 h. (F) Cell viability of LPS + IL-4 activated splenic B cells was assessed by annexin V staining. (G) Cell number at different times following stimulation of splenic B cells with LPS + IL-4 was determined by counting in a hemocytometer. (H) Cell proliferation was assessed following staining with carboxyfluorescein succinimidyl ester (CFSE). Representative flow cytometry plot of CFSE dilution at different time points in live singlet splenic B cells stimulated with LPS + IL-4 (n = 6). Max, maximum. (I) BRIT1 KO and Ctrl B cells were stimulated with LPS + IL-4 for 72 h, genomic DNA was amplified by PCR, and Sμ–Sγ1 junctions were sequenced. The percentage of junctions with the indicated nucleotide overlap is indicated (131 Ctrl and 145 BRIT1 KO sequences were analyzed from three independent experiments). (J, Left) Splenic B cells were treated with colcemid at 72 h after LPS + IL-4 stimulation, and metaphase spreads were hybridized with probes specific for sequences upstream of the Igh variable domain (5′ Igh, labeled for green signal) and sequences immediately downstream of the Igh constant region exons (3′ Igh, labeled for red signal), and then counterstained with DAPI (blue). The percentage of metaphases with split signals was quantified. At least 200 metaphases for each group were analyzed in four independent experiments. **P < 0.005. Error bars represent means ± SD. (J, Right) Representative examples show signal from an intact Igh locus (i) and Igh break (ii). (Scale bar, 1.5 μm.)

