
Fig. 1.
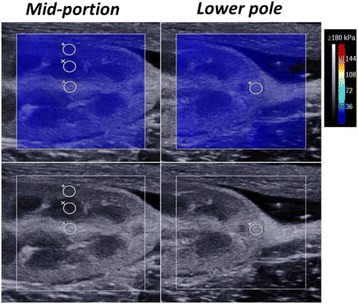
Representative images of elasticity measurement by shear wave elastography (SWE) in one kidney. The regions of interest (ROIs) were positioned in the cortex, medulla and sinus of the mid-portion and in the cortex of the lower pole using the B-mode image. The lower and upper rows show the changes in the ROI by grey-scale ultrasound and SWE, respectively. The colour map is the distribution of elasticity values scaled from 0 to 180 kPa and calculated from shear wave velocity (SWV) values using Young’s modulus (YM)