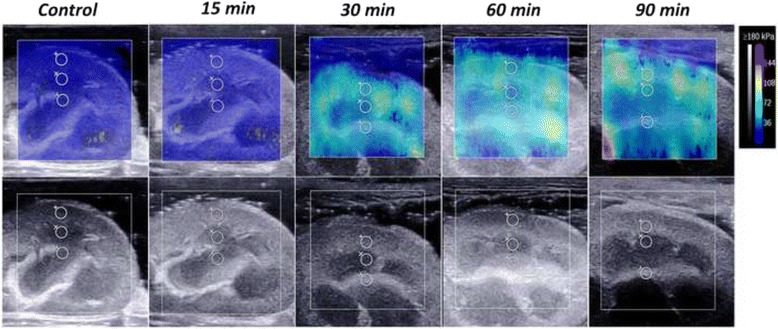
Fig. 2.

Representative images showing the progressive increase in stiffness by SWE in one kidney when the renal vein was occluded. The lower and upper rows show the changes in the ROI by grey-scale ultrasound and SWE, respectively. The colour map is the distribution of elasticity values scaled from 0 to 180 kPa
