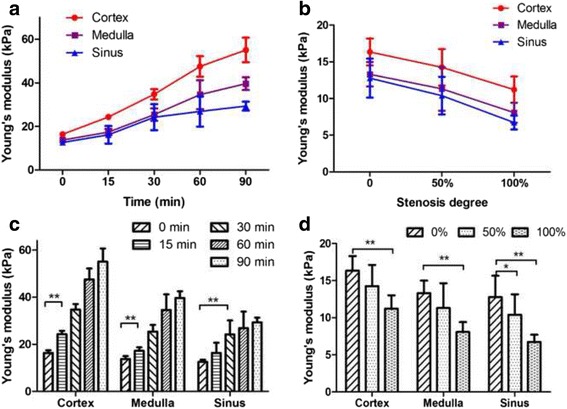
Fig. 4.

Trends of elasticity variation of the renal cortex, medulla and sinus caused by ligation of the renal vein and renal artery in vivo. The curves and histograms show the variation of YM in each compartment after ligation of the renal vein (a, c) and renal artery (b, d), respectively. Data are expressed as the mean ± SD. Intergroup comparisons were performed by paired t-test. *P < 0.05, **P < 0.01
