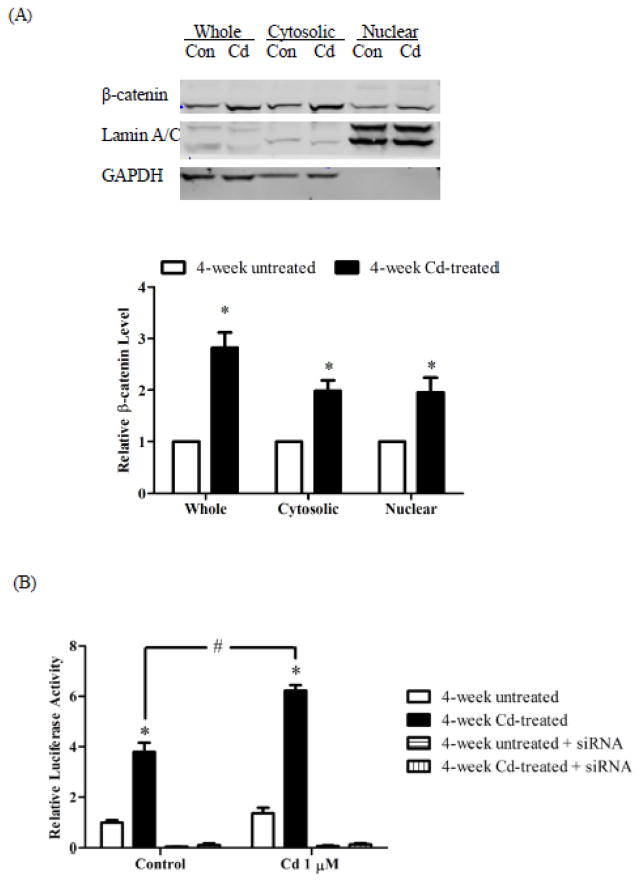
Fig. 4.
Effect of prolonged Cd treatment on β-catenin levels. The cells were cultured in DMEM supplemented with 3 μM Cd for 4 weeks. Control cells were cultured in medium alone. (A) Expression of β-catenin in cellular fractions. Representative Western blot images of β-catenin expression are shown. Lamin A/C and GAPDH were loading controls for the nuclear and cytosol fractions, respectively. Densities relative to the respective fractions of 4-week untreated cells are plotted as mean±SEM (n=3). (B) Luciferase reporter assay. Untreated and 4-week Cd-treated cells were transfected with TOPFlash and pRL-TK plasmids, serum-starved overnight, and treated with 1 μM Cd for 8 h. Firefly and renilla luciferase activities were measured. The ratio of firefly and renilla luciferase activities was normalized to untreated control cells and plotted as mean±SEM. *Significantly higher than the 4-week untreated control cells. #Significantly different at p < 0.05.

