Figure.

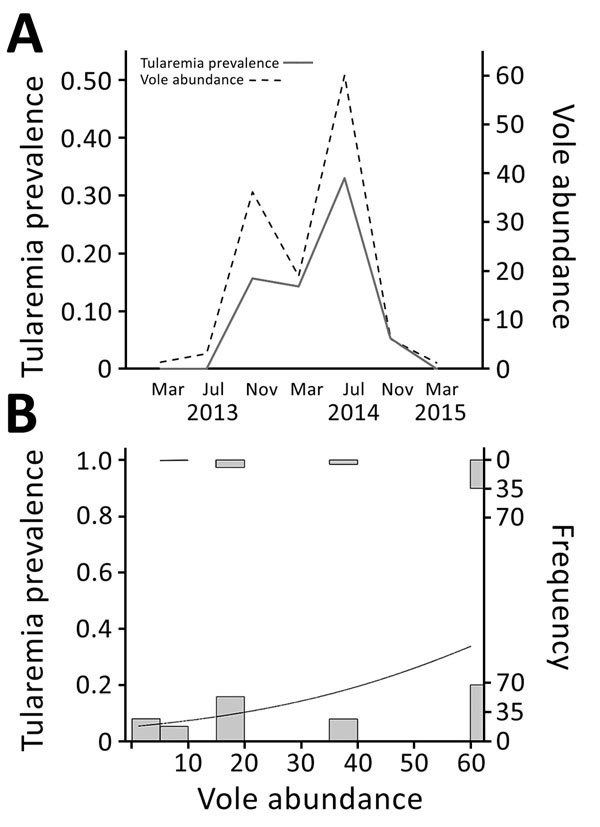
Vole abundance and tularemia prevalence, northwestern Spain. A) Temporal variations in vole abundance (no. captures/100 traps/24 h) and tularemia prevalence. Four voles were tested in March 2013, 15 in July 2013, 32 in November 2013, 63 in March 2014, 102 in July 2014, 19 in November 2014, and 8 in March 2015. B) Relationship between tularemia prevalence and vole abundance. Histograms show number of positive (top) or negative (bottom) voles sampled at each level of vole density. Curved line indicates a generalized linear model result.
