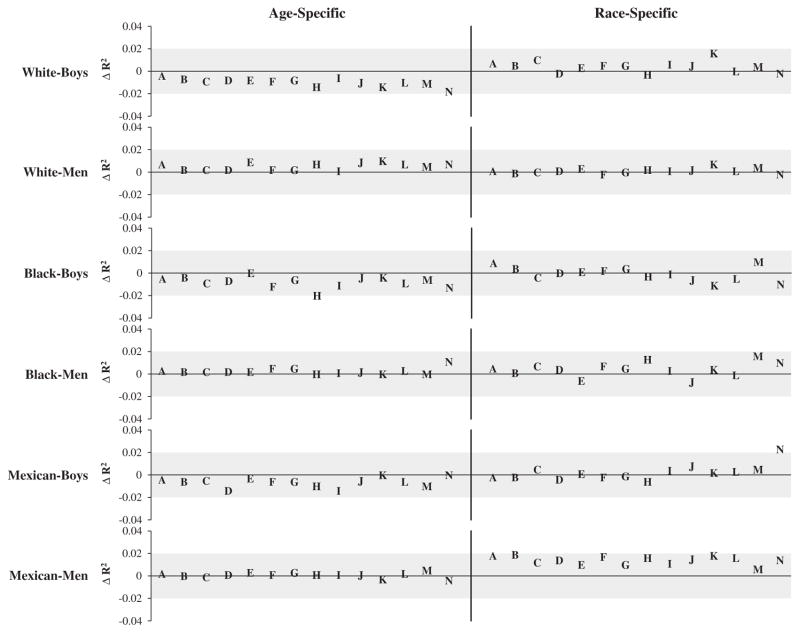
Figure 1.
Differences in R2 values between equations developed in all males in the fitting sample versus equations developed in age- and race/ethnic-specific subgroups of the fitting sample (R2 all males – R2 subgroup). R2 values are for the prediction of criterion percent body fat from DXA and were calculated in age- and ethnic-specific subgroups of the validation sample using the different equations developed in the fitting sample. Letters represent results for models shown in the footnote of Table 2 with the point estimate at the center of the letter. NHANES 1999–2006.

