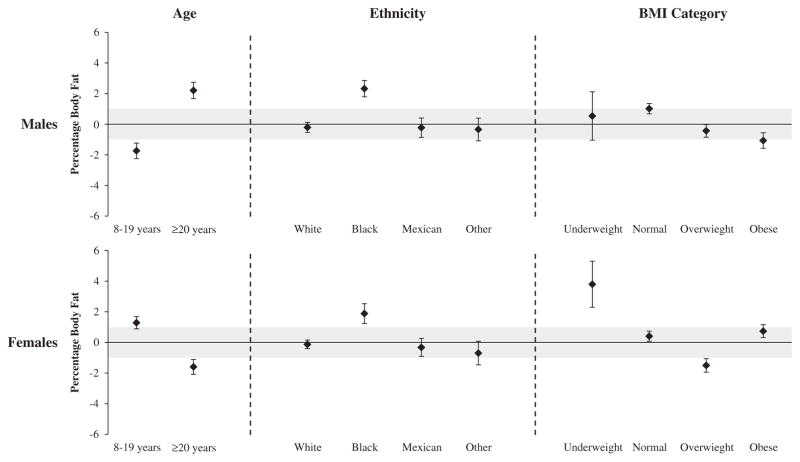
Figure 3.
MSD between percent body fat measured by DXA compared with values predicted using BMI in the cross-validation data set within subgroups by age, ethnicity and BMI category: BMI predicted percent body fat minus percent body fat from DXA. A value above zero indicates that the equation developed in the full fitting sample had a higher R2 in the validation sample than the equation developed in boys only, and values below zero indicate that the equation developed in the full fitting sample had a lower R2 compared with the equation developed in boys only. The letters on the plot identify result from different equations with the point estimate at the center of the letter. NHANES 1999–2006.

