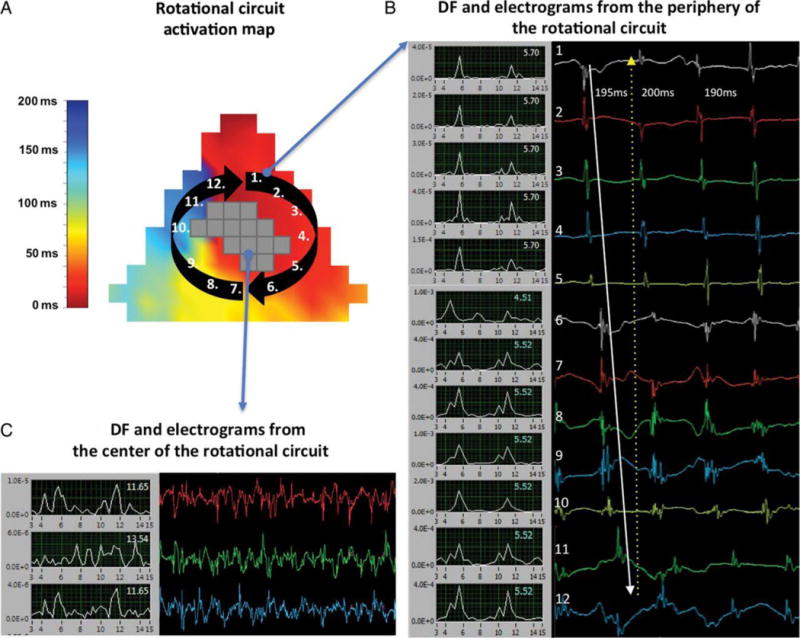
Figure 5.

A. Activation map of a clock-wise revolution of a rotational circuit at the posterior left atrial wall. Electrodes registering CFAEs at the core are shown in grey (no local activation times were assigned given their ambiguity). B. Frequency domain (left, 3–15 Hz) and time domain (right) electrograms from sites just outside the core (1–12). The blue numbers in the frequency domain signals display dominant frequencies. The white arrow in the time domain displays the clock-wise sequence of activation. C. Frequency domain (left, 3–15 Hz) and time domain (right) CFAEs from sites inside the core (reproduced from Lee et al.40 by permission of Oxford University Press).
