
Figure 8.
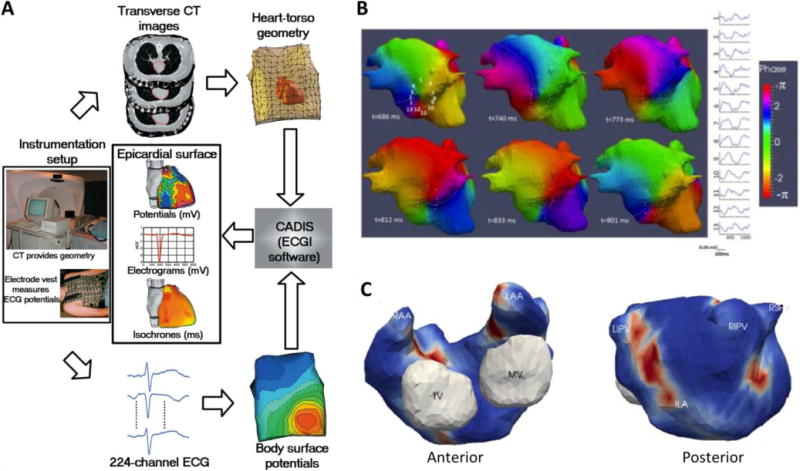
A. Block diagram of the electrocardiographic imaging (ECGI) procedure. B. Phase mapping of ECGI data in a persistent AF patient. A full rotation of a rotor in the inferior left atrium is displayed. Electrograms around its core are also shown (1–12). C. Example of a driver density map used to guide the ablation process in a patient with drivers clustered in 3 regions: inferoposterior left atrium (ILA) and right and left pulmonary veins (A reprinted from Ramanathan et al.45 by permission from Macmillan Publishers Ltd; B–C reproduced from Haïssaguerre et al.6).