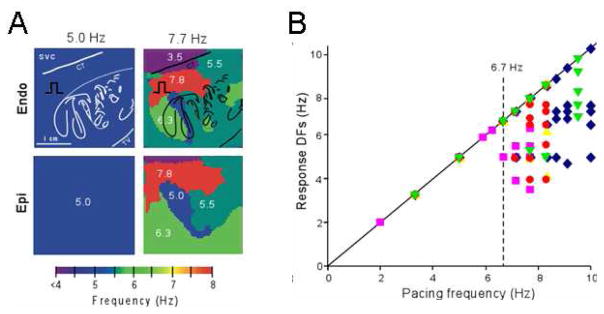
Figure 2.
The ‘breakdown frequency’ in a sheep heart. A. Endocardial and epicardial DF maps of same isolated RA preparation paced at 5.0 and 7.7 Hz. Note appearance of heterogeneous DF domains at 7.7 Hz. B. Response DFs versus the pacing rate (n=5). Each symbol represents one experiment. Pacing BB at rates below ~6.7 Hz, results in 1:1 activation. At higher rates, the number of domains increases but the DFs’ value decrease. SVC, superior vena cava; CT, crista terminalis. From Berenfeld O, Zaitsev AV, Mironov SF, Pertsov AM, Jalife J. Frequency-dependent breakdown of wave propagation into fibrillatory conduction across the pectinate muscle network in the isolated sheep right atrium. Circ.Res. 2002;90:1173–1180; with permission.

