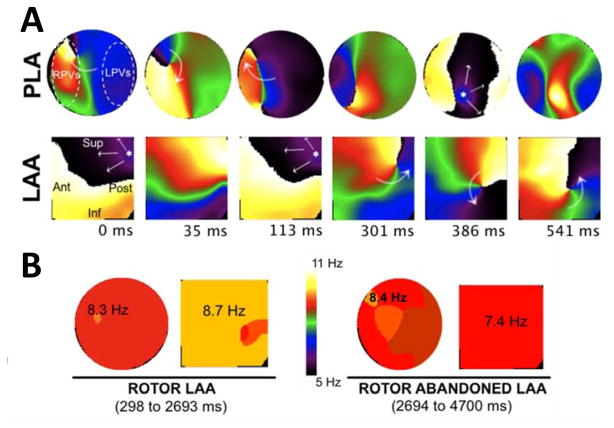
Figure 3.
Patterns of activation in the PLA and LAA of isolated hearts during AF. A. snapshots from a phase movie show a rotor appearing in the field of view of the LAA. The patterns of activation switch from breakthroughs (0-to-113 ms) to a meandering rotor (301-to-541 ms). B. the DFmax is in the LAA when the rotor stays in the field of view and goes back to PLA when the rotor drifts outside the LAA. Adapted from Filgueiras-Rama D, Price NF, Martins RP, Yamazaki M, Avula UM, Kaur K, Kalifa J, Ennis SR, Hwang E, Devabhaktuni V, Jalife J, Berenfeld O. Long-term frequency gradients during persistent atrial fibrillation in sheep are associated with stable sources in the left atrium. Circulation. Arrhythmia and electrophysiology. 2012;5:1160–1167; with permission.

