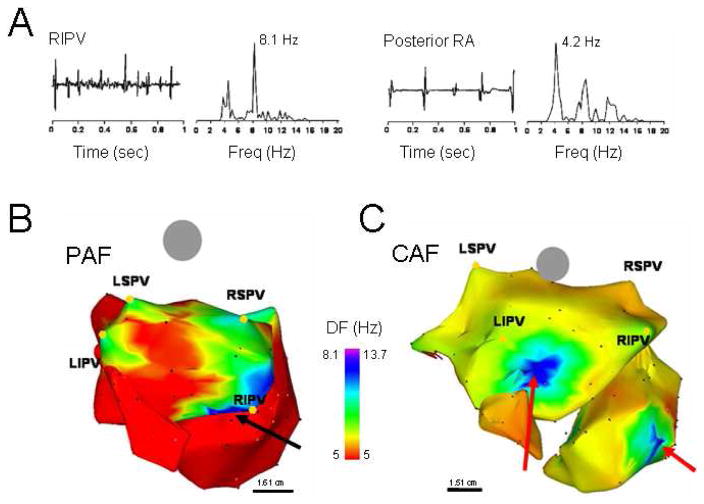
Figure 6.
DF analysis in AF patients. A. Bipolar electrograms and corresponding power spectra obtained from the RIPV (left) and posterior RA in a patient with spontaneous paroxysmal AF. Each site shows distinct DF (8.1 and 4.2 Hz in RIPV and RA, respectively) demonstrating the utility of spectral analysis. B. DF map in a patient with paroxysmal AF (Posterior-anterior view; 6 hours). Note HDF sites in each of the PVs. Ablation sequence in this patient was LSPV, LIPV RSPV and RIPV (site of AF termination, black arrow); AFCL increased by 10 ms, 25 ms, 9 ms and 75 ms, respectively, before termination. C. DF map in a patient with permanent AF (24 months). The maximal DF and atrial frequency are higher than the patient in panel A. In addition, HDF sites are located outside the PVs (red arrows). Ablation sequence in this patient was RIPV, RSPV, LSPV and LIPV; AFCL increased by 5 ms, 2 ms, 0 ms and 5 ms respectively. Color-bar, DF scale in Hz. PAF: paroxysmal AF, CAF: permanent AF, LSPV, LIPV, RSPV, RIPV: Left/right superior/inferior pulmonary veins (PVs). From Sanders P, Berenfeld O, Hocini M, Jais P, Vaidyanathan R, Hsu LF, Garrigue S, Takahashi Y, Rotter M, Sacher F, Scavee C, Ploutz-Snyder R, Jalife J, Haissaguerre M. Spectral analysis identifies sites of high-frequency activity maintaining atrial fibrillation in humans. Circulation. 2005;112:789–797; with permission.

