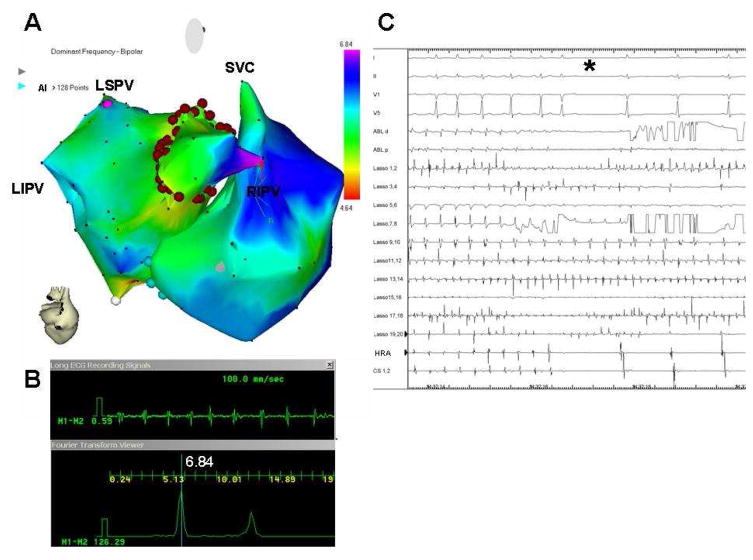
Figure 7.
A, Real-time atrial DF map (posterior view; CARTO system) in a paroxysmal AF patient. Purple, primary DFmax site (red arrow) on right intermediate PV (RIPV). Red dots, circumferential ablation line. B, bipolar recording (top) of primary DFmax site and its power spectrum (bottom) prior to ablation. C, surface ECG leads and intracardiac lasso catheter electrograms within RIPV; ablation catheter in the encircled area, CS and HRA catheter during isolation of right-sided PVs. Catheters recording outside the encircled area (CS, HRA) show conversion to SR (star) whereas the lasso catheter inside RIPV demonstrates ongoing AF. From Atienza F, Almendral J, Jalife J, Zlochiver S, Ploutz-Snyder R, Torrecilla EG, Arenal A, Kalifa J, Fernandez-Aviles F, Berenfeld O. Real-time dominant frequency mapping and ablation of dominant frequency sites in atrial fibrillation with left-to-right frequency gradients predicts long-term maintenance of sinus rhythm. Heart rhythm : the official journal of the Heart Rhythm Society. 2009;6:33–40; with permission.

