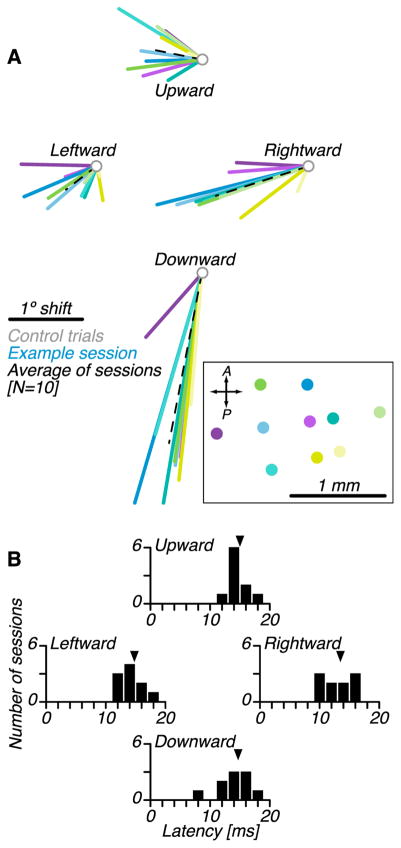
Figure 7.
Effects of optical stimulation on saccade trajectories across all behavioral sessions. (A) Average changes in saccade end points for each stimulation site (N=10 stimulation sites, colored lines) and across sites (dashed line). Inset (black box) shows the location of stimulation sites within the recording chamber in the same color code. (B) Latency of the first significant change in saccade velocity after stimulation onset (see STAR Methods).

