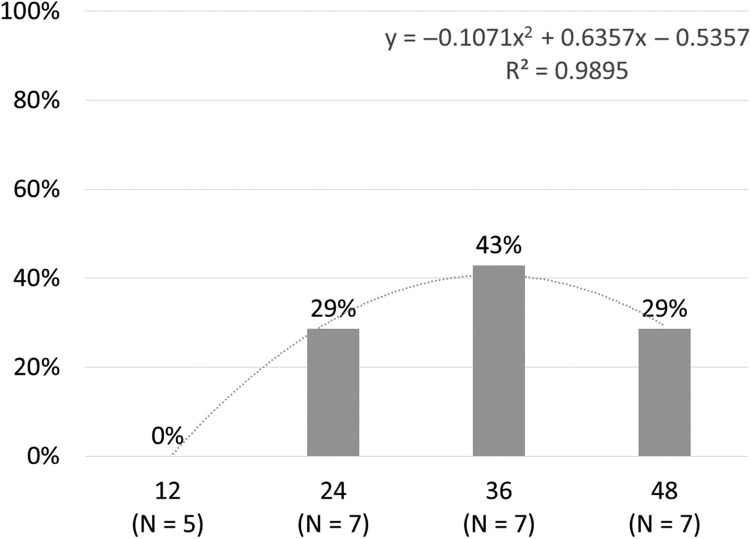
Figure 1.
Percentage of children responding to the treatment on the basis of a posttreatment definition score of 5 or higher for treated words in block 7 (the last block) for each treatment intensity condition (12, 24, 36, and 48). The trend line illustrates the polynomial trend also depicted by the regression equation. Posttreatment treated words are shown in shaded bars.

