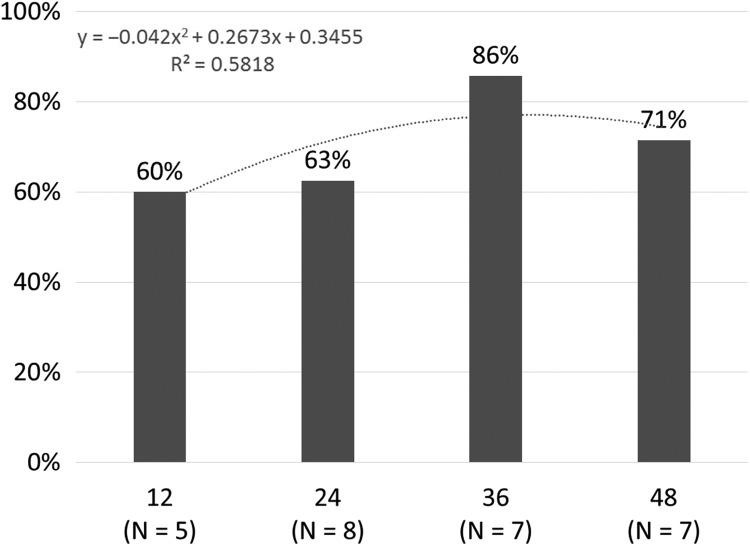
Figure 3.
Percentage of children responding to the treatment on the basis of naming data (i.e., posttreatment naming score of 4 or higher for treated words) in block 7 (the last block) for each treatment intensity (12, 24, 36, and 48). The trend line illustrates the polynomial trend also depicted by the regression equation.

