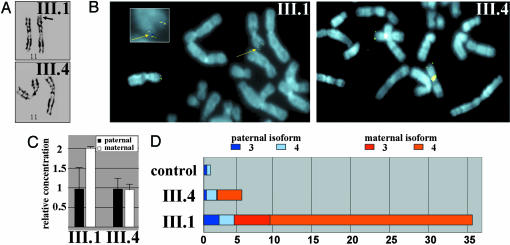
Fig. 3.
Chromosome analysis, genomic quantitation of IC1 alleles, and quantitative RT-PCR analysis of allelic IGF2 expression. (A) Metaphase spreads of primary fibroblasts from an affected individual (III.1) and unaffected individual (III.4) were analyzed. High-resolution GTG banding revealed a prolonged 11p15 subtelomeric region (black arrow) on one chromosome 11 of the proband. (B) FISH analysis with a genomic probe for IGF2 shows two signals on one chromosome 11 of the proband (yellow arrow), indicating a duplication of distal 11p. (Inset) An enlarged view of 11p to illustrate the duplication (yellow arrow). (C) Quantitation of IGF2 gene dosage by using real-time PCR quantification. (D) Quantitative RT-PCR analysis, haplotype-specific expression, and promoter usage of the IGF2 gene. The relative IGF2 mRNA amounts are represented by horizontal bars, with colored segments denoting contribution of the parental haplotypes. As well, the relative contribution to IGF2 expression by the P3 or P4 promoters is indicated by darker and lighter shading, respectively. Allelic contribution to expression levels was determined by sequencing cloned transcripts of all individuals heterozygous for a SNP in IGF2 exon 9.

