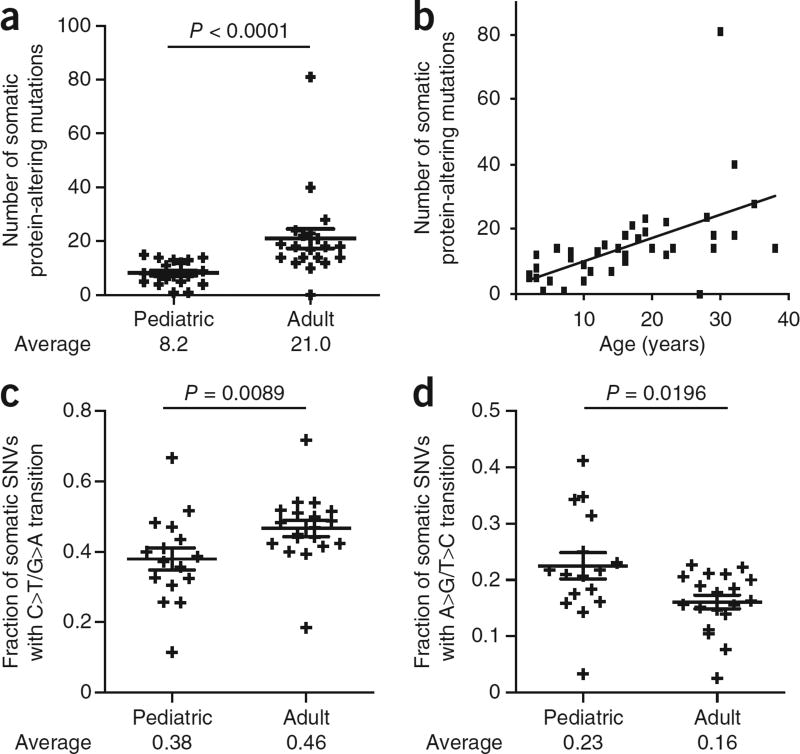
Figure 1.
Correlation between the age of the affected individual and mutation number and type. (a) Plot showing the number of protein-altering somatic mutations in pediatric (≤15 years) and adult (≥16 years) individuals with T-ALL. Averages and s.e.m. are shown. The P value tested whether there was a significantly different mutation number in adults versus children and was calculated using the two-tailed Wilcoxon signed-rank test. Pediatric cases, n = 19; adult cases, n = 20. (b) Dot plot representing the number of protein-altering somatic mutations versus age of the affected individual. (c,d) Plots showing the fraction of somatic SNVs that were C>T/G>A transitions (c) or A>G/T >C transitions (d) in pediatric and adult individuals with T-ALL. Averages and s.e.m. are shown. Samples with fewer than ten somatic SNVs were excluded from this analysis. The reported P values test whether there was a significant difference between adults and children and was calculated using the two-tailed Wilcoxon signed-rank test. Pediatric cases, n = 16; adult cases, n = 19.

